

Current Price: 45,280
Status: Testing new All-Time High (ATH) breakout level
Change (daily): +196 (+0.43%)
Technical Analysis

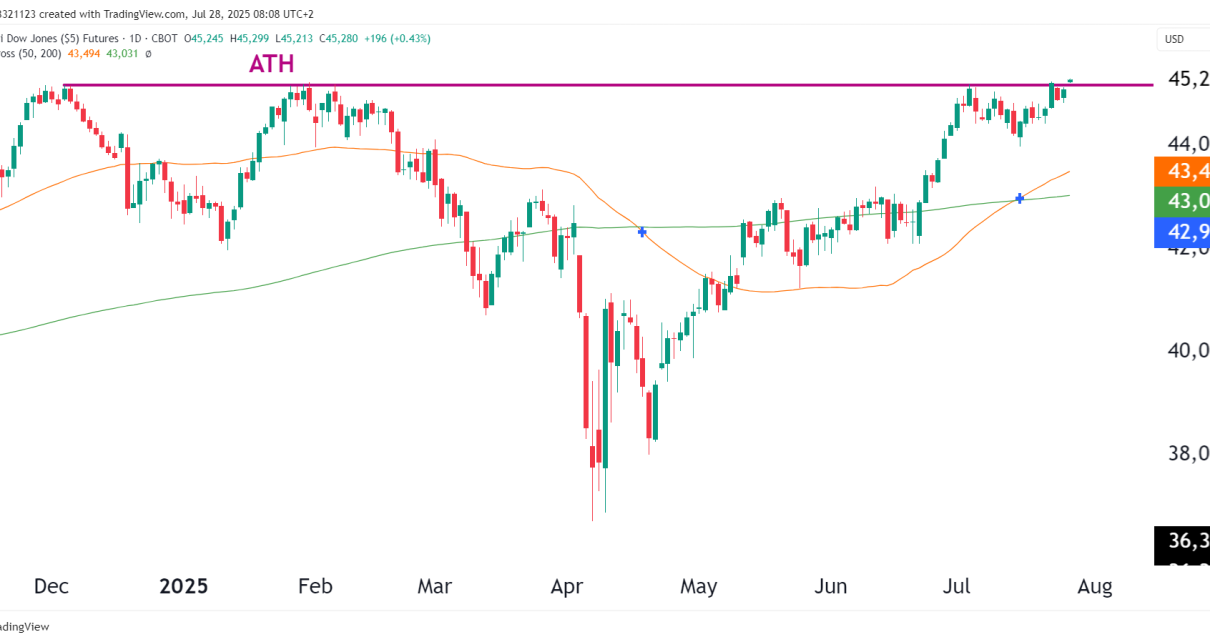
The Dow Jones Industrial Average (YM) has now caught up with the rest of the U.S. majors and is testing its ATH resistance near 45,280.
- 🟪 ATH Level: 45,280 – Horizontal resistance now being tested.
- 🟧 50-day MA: 43,494 – Clear upward slope.
- 🟩 200-day MA: 43,031 – Recently crossed above by 50-day MA (Golden Cross).
- 📈 Trend: Strong uptrend from the May bottom, clean series of higher highs and higher lows.
- 🟦 Breakout Triggered: Price has not closed above the ATH yet, but bulls are trying.
Relative Strength vs Other U.S. Indices
| Index | Status vs ATH | Current Stance |
|---|---|---|
| NQ (NASDAQ 100) | Above ATH | Stalling near Bollinger upper band |
| ES (S&P 500) | Above ATH | Trending higher, RSI overbought |
| RTY (Russell 2000) | Below ATH | Catch-up mode, consolidating |
| YM (Dow Jones) | Breaking ATH | Follows suit with ES/NQ; late rotation |
The Dow is following the rest of the market now but not as aggressively as the S&P 500 and the NASDAQ as tech heavy sectors are getting more of a boost. From here, bulls will attempt to push it even higher in order to get a close above the ATH.
Macro & Rotational Tailwinds
- Sector rotation out of tech into industrials and materials (Dow-heavy sectors).
- Bond yields steadying, giving room for equities with exposure to rate-sensitive sectors.
- Infrastructure spending news (both domestic and international) aiding industrial sentiment.
- Global risk tone still favorable despite ongoing Middle East noise.
Short-Term Technical Scenarios
| Scenario | Estimated Probability | Reasoning |
|---|---|---|
| Clean Breakout → 46,000+ | 45% | Breakout momentum from industrials, participation broadening |
| Retest 44,800–45,000 zone | 40% | Low-volume breakout may get retested; watch RSI and volume |
| False breakout → Pullback below 44,500 | 15% | Only if macro data surprises negatively (e.g., FOMC hawkish shift) |
Time Frame Outlook
Short-Term (1–5 days):
Constructive breakout. Momentum is solid, though a brief retest of 45,000 is possible.
Medium-Term (2–4 weeks):
Healthy sector rotation favors Dow constituents. Tech may cool, but YM could keep grinding higher toward 46,000 if macro remains benign.
Long-Term (2–6 months):
Fundamentally sound, especially if rate cuts begin to materialize by Q4, or if earnings breadth improves further.
Final Thoughts
The Dow has finally joined the other indices in breaking out above its ATH. The only other one left is RTY, but for now, as the Dollar remains weaker, we should continue to see strength in the US indices.
