


Introduction
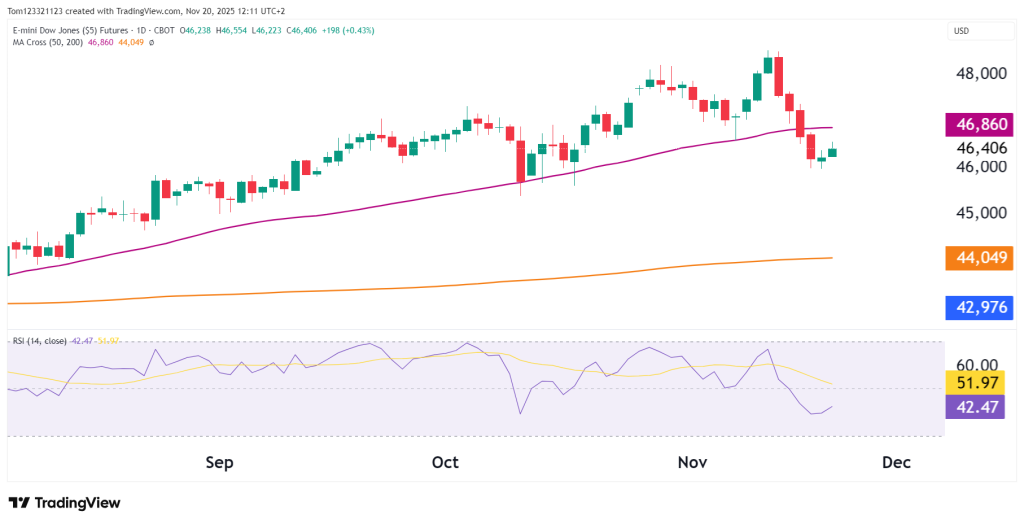
E-mini Dow Jones Futures (YM) have dipped 5.2% from the recent all-time high of $48,542. The selloff has meant the price has dipped below the 50-day moving average, which bulls will be looking to reclaim. The 200-day moving average is far below the current price; it would be a further drop of 5% for prices to test that level, and it would put the more extended-term bull trend in jeopardy.
Lets take a closer look at the technicals and what they tell us.
Dow Technical Overview
The Dow Futures (YM) are testing key technical levels after a sharp pullback, but a bounce could be possible soon.
Price briefly slipped below the 50-day moving average (46,860) intraday but quickly reclaimed it, showing buyers are defending this zone for now. A short-term bounce is also forming near 46,000, an area that acted as a floor in late October and is now attracting renewed demand.
Despite the drop from the 48,000 zone, where sellers stepped in aggressively, the overall trend remains bullish as long as YM stays above the rising 50-day MA and well above the 200-day moving average at 44,049.
That said, the formation of lower highs signals that momentum is fading, and bulls need to push the index back above 46,900–47,000 to regain the upper hand.
The RSI, which recently hit 42, is starting to recover, suggesting selling pressure is easing. A move above 52 would confirm improving momentum and support a stronger rebound.
Key levels to watch:
- Holding 46,000 opens the door for a push toward 47,000+
- Losing 46,000 risks a drop to 45,500, with deeper support at the 200-day MA near 44,049
Dow Key Technical Levels
| Type | Level | Description |
|---|---|---|
| Resistance 1 | 46,800–47,000 | 50-day MA. |
| Resistance 2 | 47,500 | Minor supply zone. |
| Resistance 3 | 48,200 | November swing high. |
| Support 1 | 46,000 | Short-term floor. |
| Support 2 | 45,500 | Recent demand region. |
| Support 3 | 44,050 | 200-day MA. |
Probability Table (Next 2–3 Weeks)
| Scenario | Estimated Probability | Notes |
|---|---|---|
| Stabilization above the 50-day MA → move toward 47,200–47,500 | 50% | Strong trend support at this level. |
| Sideways consolidation between 45,800–47,000 | 35% | Likely if momentum stays weak but selling cools. |
| Breakdown toward 45,000–44,500 | 15% | Only if the Dow loses the 46,000 level with volume. |
Summary
YM is attempting to stabilize after a sharp pullback, with buyers stepping in around the 50-day moving average. The broader uptrend remains intact, but the Dow needs a push back above 46,800–47,000 to confirm renewed momentum.
Support at 46,000 is crucial, holding above it would keep the outlook constructive. A break below increases risk of a deeper retracement toward 45,500 or even 44,000.
This analysis is for educational and informational purposes only and does not constitute trading advice or a recommendation to buy or sell any futures contracts. Futures trading involves significant risk and may not be suitable for all investors. Always conduct your own research and consult with a licensed financial professional before making trading decisions.
