

Introduction
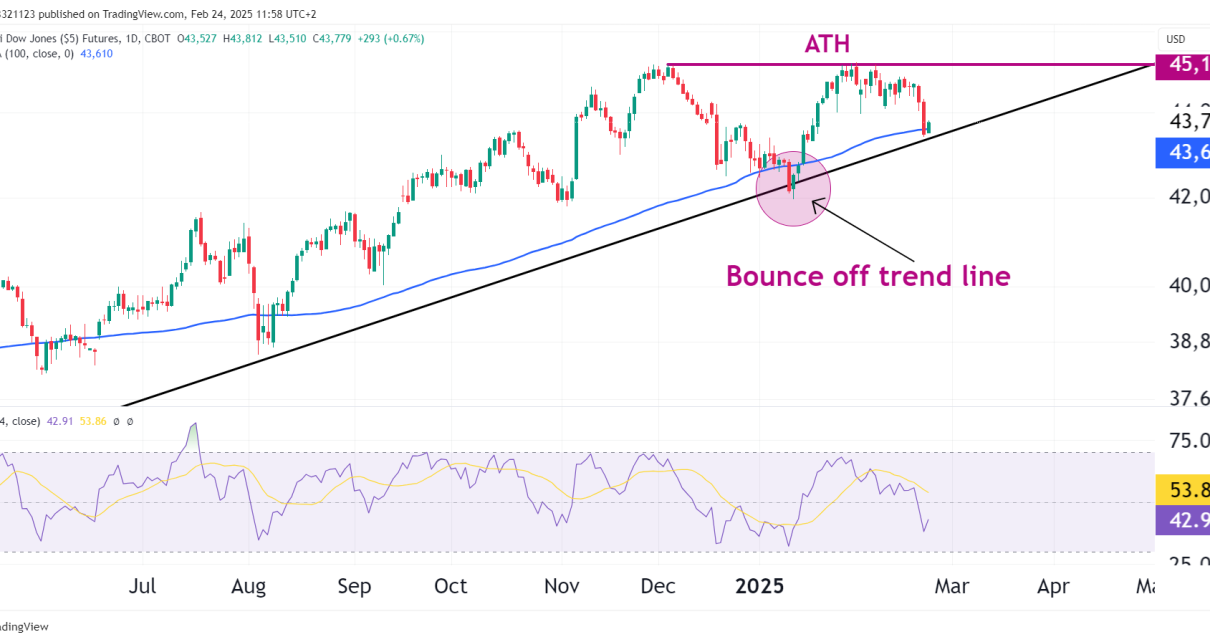
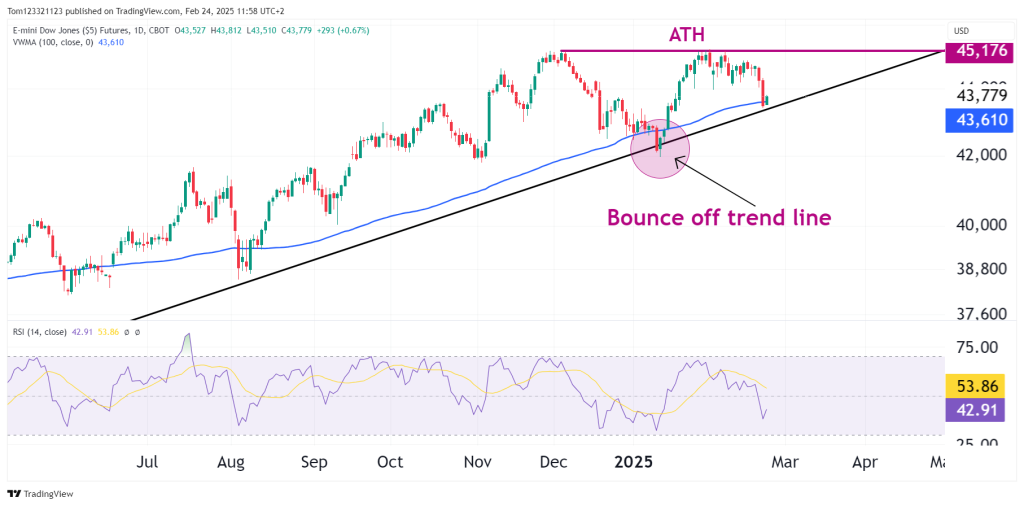
E-mini Dow Jones futures (YM) have rebounded off trendline support, regaining strength after a recent pullback. Price tested the ascending trendline and the 100-day VWMA (43,610), holding above these levels and keeping the long-term uptrend intact.
Market Drivers & Key News Events
- Federal Reserve Rate Outlook: The market continues to price in potential rate cuts later in 2025, despite recent inflation data coming in slightly above expectations. Lower rates historically benefit Dow components, particularly industrials and financials.
- Earnings Season Impact: Several blue-chip stocks in the Dow Jones have reported mixed earnings, though mega-cap strength in sectors like healthcare and consumer staples has helped stabilize the index.
- Technical Support Held: The Dow bounced off a critical trendline, suggesting buyers remain active on dips. If broader equity markets maintain momentum, YM could make another run at ATH levels.
Technical Analysis
Bounce from Trendline—Higher Lows Intact
- YM tested and held the rising trendline, confirming long-term trend support.
- The 100-day VWMA (43,610) remains intact, reinforcing the bullish structure.
- RSI rebounded from 42.91, avoiding oversold conditions and keeping momentum neutral.
Key Support & Resistance Levels
- Resistance Levels:
- 44,500 (Intermediate Resistance Before ATH Test)
- 45,176 (All-Time High – Key Breakout Level)
- Support Levels:
- 43,610 (100-day VWMA – Short-term Support)
- 43,000 (Trendline Support – Must Hold to Sustain Uptrend)
- 42,500 (Break Below Would Weaken Structure)
A break above 45,176 would open the door for new highs, while a failure here could lead to consolidation or another test of trendline support.
Momentum & Market Sentiment
- 100-Day VWMA Holding: Price remains above it, confirming the uptrend remains valid.
- RSI at 53.86: Neutral momentum, not overbought or oversold, leaving room for upside.
- Strong Bounce from Support: Buyers stepped in quickly, suggesting demand remains intact.
The trend remains bullish, but momentum needs to push through resistance for a retest of ATH levels.
Bull & Bear Scenarios
Bull Case: Break Above 45,176 (ATH)
- If YM clears 45,176, price could accelerate.
- Fed rate-cut expectations and rotation into Dow components would support further upside.
Bear Case: Rejection at Resistance & Retest of Trendline
- Failure to break ATH could lead to a pullback toward 43,610 (VWMA support).
- A break below 43,000 (trendline) would shift momentum lower, targeting 42,500.
Final Outlook
- Short-Term (1-2 Weeks): Bullish, watching for a move toward 44,500 – 45,176.
- Medium-Term (1-3 Months): Bullish as long as YM holds above 43,000.
- Long-Term (6+ Months): Uptrend intact unless YM breaks below trendline support.
