

Introduction
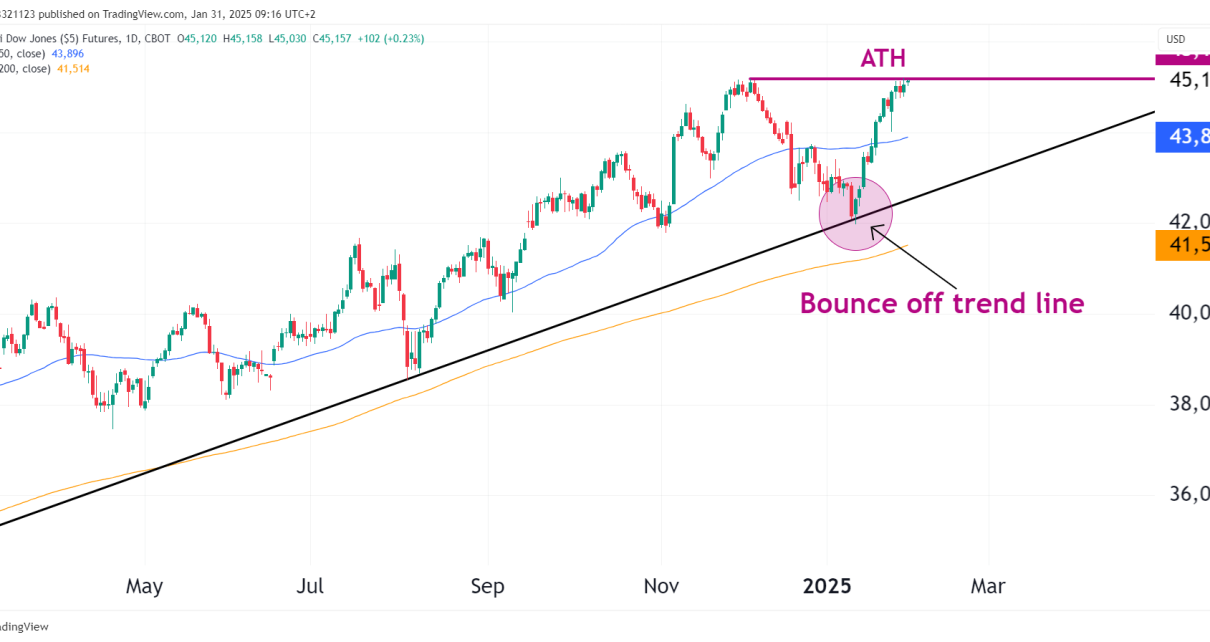
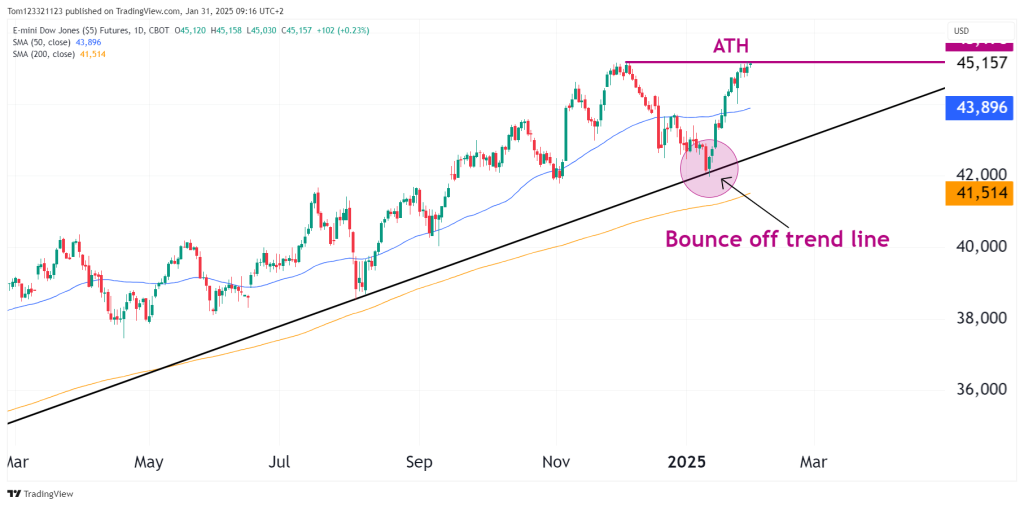
The E-mini Dow Jones Futures (YM) are once again testing all-time highs (ATH), after staging an impressive bounce off a long-term trendline support. The index has been in a steady uptrend just like all US indices.
While buyers have driven price action toward record levels, the key question now is whether Dow futures can break through or if this will turn into another rejection. We are bullish but lets look at the technical analysis more in depth.
Technical analysis overview
Bounce-Off Trendline Support
- The upward-sloping trendline was tested in mid-January, leading to a lot of buying pressure toward all time highs.
- This bounce coincided with the 50-day SMA (43,896).
All-Time high retest
- Bulls need a confirmed breakout for continuation, while bears will be watching for potential rejection.
Support and resistance levels
Resistance Levels (Upside Targets)
- 45,157 (ATH) – The key level that price must break above for further gains.
- 46,000 – Psychological round-number resistance, likely to be the next major upside target if ATH is breached.
Support Levels (Downside Risks)
- 44,000 – Minor Support – A level of recent consolidation that may provide short-term stability.
- 43,896 (50-day SMA) – A major technical support level, where buyers previously stepped in.
- 41,514 (200-day SMA) – A significant long-term support level, aligning with the ascending trendline.
Scenarios to watch
Bullish Case: Breakout Above ATH (Higher Probability – 65%)
- A decisive daily close above 45,157 would confirm a breakout and open the door to new highs.
- If bullish momentum sustains, 46,000+ could be the next upside target.
Bearish Case: Rejection at ATH (Lower Probability – 35%)
- A failure to break above 45,157 could result in a pullback toward 44,000 or even the 50-day SMA at 43,896.
- A break below the 50-day SMA would shift momentum more bearish, with potential downside to 41,514 (200-day SMA).
Trade Setups
Bullish Setup (Breakout Trade)
- Entry: Long above 45,200, confirming a breakout.
- Target: 46,000.
- Stop-Loss: Below 44,800 to limit risk.
Bearish Setup (Rejection Trade)
- Entry: Short on a failed breakout and rejection from 45,157.
- Target: 44,000, with extended target at 43,896 (50-day SMA).
- Stop-Loss: Above 45,300 to protect against a breakout.
