


Technical Outlook
Price Zones
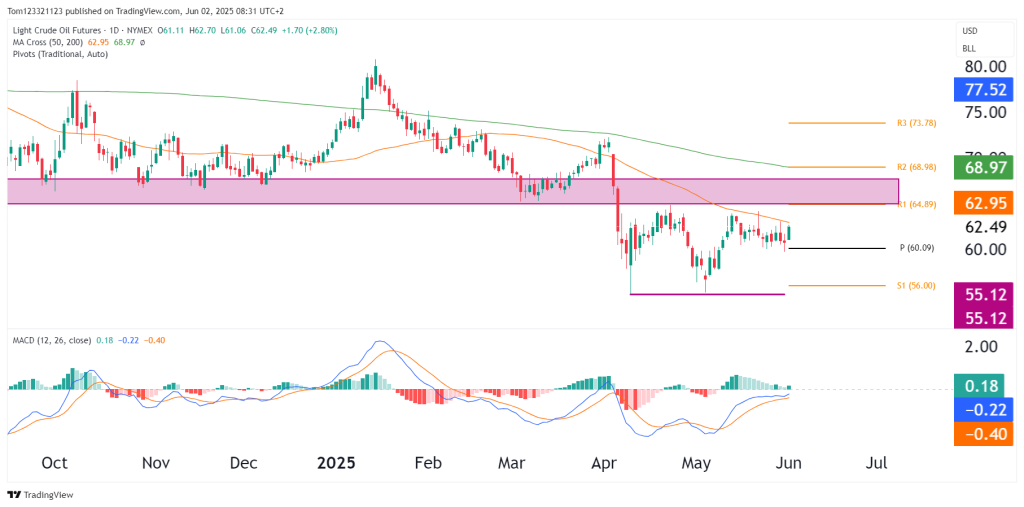
- Immediate support: $60.00 (pivot zone)
- Range support (floor): $55.12 (multi-month base)
- Immediate resistance: $62.95 (50-day MA)
- Key overhead resistance: $64.89–$68.97 (prior demand → supply flip zone + R1/R2)
- Major resistance (R3): $73.78
Moving Averages
- 50-day MA (orange): $62.95 – being tested right now
- 200-day MA (green): $68.97 – a magnet zone if momentum builds
→ Trend is still technically bearish, but the flattening 50MA shows a potential trend shift underway.
Bull and Bear Scenarios
Bull Case
- Price is building higher lows from the $55 base and attempting to break through the 50MA
- MACD has shifted to bullish mode
- Break and close above $64.89 → opens the path to $68.90–$70+ test
- A strong weekly close above $65 would trigger medium-term bullish breakout confirmation
Bear Case
- The $64.89–$68.97 zone is dense resistance, with both MAs and prior supply congestion
- If price gets rejected here, a return to $60 or even $56–$55 is possible
- Break below $60.00 will invalidate near-term bullish momentum
Trade Setups
Range Breakout Buy Setup
- Entry trigger: Close above $65.00
- Target: $68.90 (200MA) → $73.78 (R3)
- Stop: Below $61.50
- Confidence: High if breakout comes with increasing volume and bullish macro tailwinds (e.g., inventory drawdowns or geopolitical tension)
Range Support Bounce
- Entry: $60.00–$60.50 (pullback into pivot)
- Target: $64.80
- Stop: Below $58.90
- Confidence: Medium – depends on whether recent bullish MACD crossover holds
Outlook Summary
| Timeframe | Bias | Commentary |
|---|---|---|
| Short-Term | Consolidation | Attempting breakout of range; test underway at $63 |
| Medium-Term | Neutral → Bullish | MACD flip, but still under key MAs – breakout above $65 needed |
| Long-Term | Bearish Bias | Still below the 200-day MA; trend structure favors bears unless $70 is recaptured |
Watch for volume and macro catalysts (OPEC+, inventories, China demand).

