


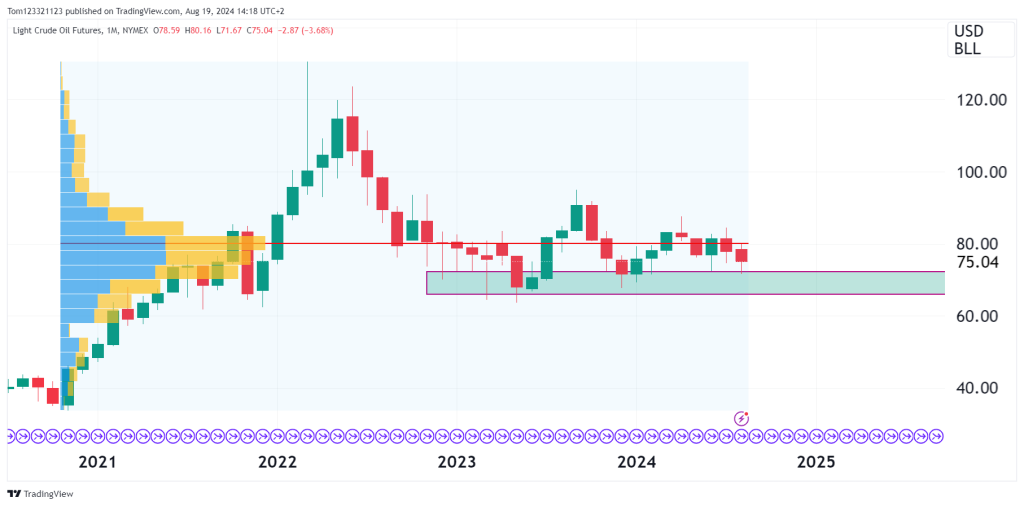
Monthly Chart
The monthly chart gives us a good idea of where CL has been sitting since the start of 2023. The longer the price sits in the tight range the stronger the break out will be but at the moment CL is being pushed around a lot by fundamentals.
The volume profile point of the control line is at $80, and it acting like a magnet to price. If we see price rally above $87 then we bulls are in the driving seat and it could lead to price hitting $100.
There is also a strong support zone at $70 which bears have been unable to push prices below.
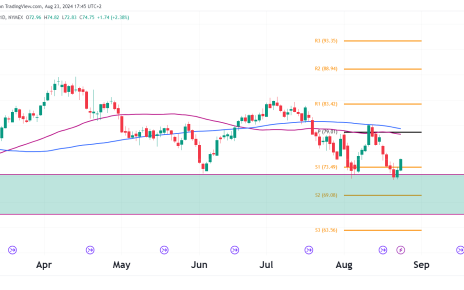
Trade Opportunities
Bull Trade
If price drops into the support zone, longs can be taken with stops below the $69 to protect against a bearish break. There is also the possibility of candlesticks turning bullish on the daily, which traders could go long at.
Bear Trade
The bears can take shorts if price fails to rally above the pivot point at $79 or the R1 at $83.42. Stops can be placed above $84 to protect against a bullish break.

