


Introduction
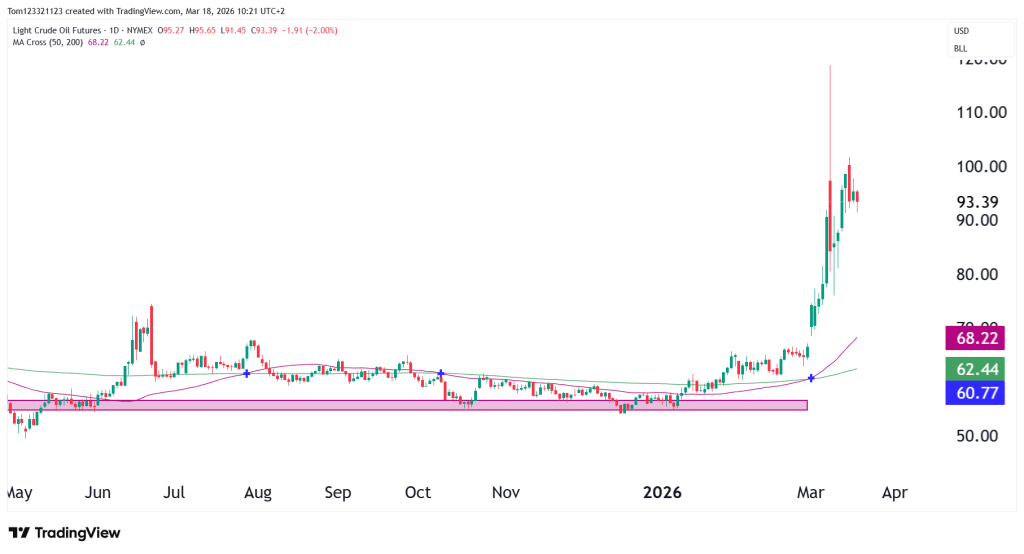
Crude Oil (CL) has now begun to find its feet since the start of the war in the Middle East. The picture for CL has been one of price discovery after a massive spike in the price. See our previous analysis here.
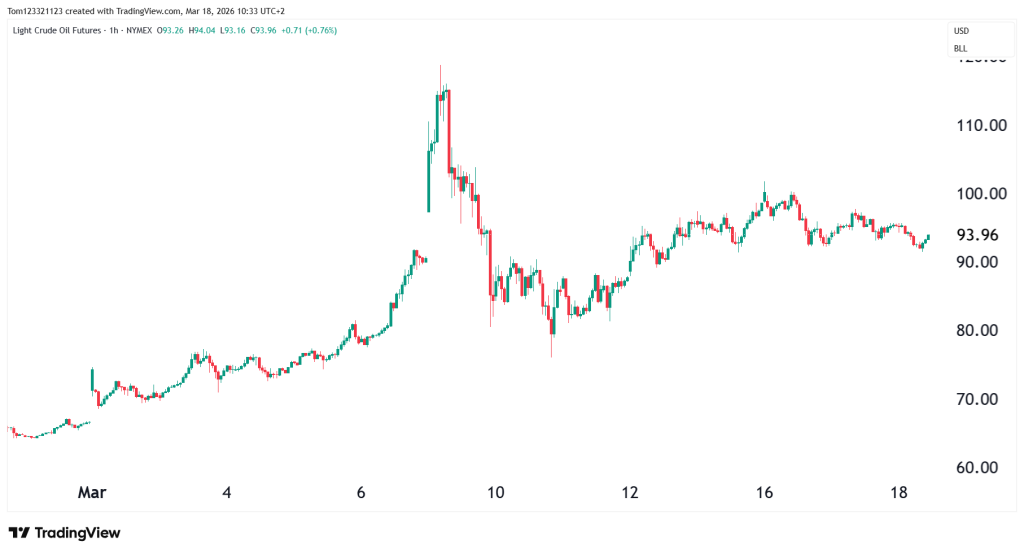
After the initial surge and sharp rejection, price has begun to stabilize in the $90–$100 region, forming a short-term range. If we look at a shorter-term chart now, like the hourly chart below, we can see that the chart is painting higher highs and higher lows. Basically, it is starting to stabilize and move higher slowly.
Market Structure & Trend

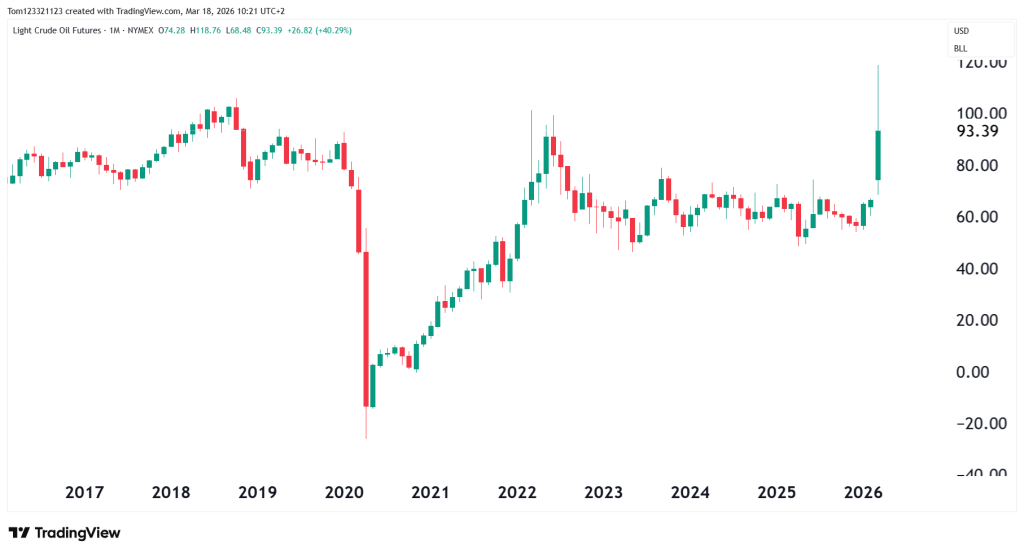
Monthly Chart – Structural Breakout Context
Key Technical Levels
Resistance
$100 – $105
- Psychological level
- Recent rejection zone
- Break above = continuation signal
$115 – $120
- Spike highs
- Extreme supply shock pricing zone
Support
$90
- Current range support
- Most important near-term level
A break below this would shift momentum bearish short term.
$80
- Next major support
- Likely target on deeper retracement
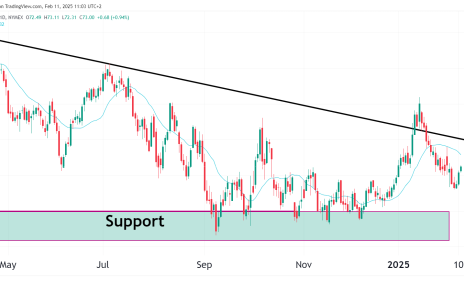
$65–$70
- Breakout origin
- Moving average confluence
Probability Table
| Scenario | Description | Estimated Probability |
|---|---|---|
| Range Consolidation | Price holds between $90–$100 as market digests geopolitical premium. | 45% |
| Bullish Continuation | Break above $100 leads to renewed momentum toward $110–$120. | 35% |
| Bearish Pullback | Breakdown below $90 triggers retracement toward $80 or lower. | 20% |
Possible Trades
With price action favoring the bulls, there is no need to fight the trend.
Longs above the 200 MA on the hourly chart (91.92) with profit taking on impulse moves higher. Anything below $90 makes things more difficult for the bulls.
Final takeaway
The key here is that prices are staying above $90. This shows the market still sees geopolitical risk as important and hasn’t brushed it off.
At the same time, prices are not pushing higher right now. That suggests the market is pausing rather than trending in a clear direction. For traders, this is a typical period after a major event. Volatility stays high, prices move within a defined range, and news headlines can quickly shift the market.
The important levels to watch are $100 as a potential breakout point and $90 as a potential breakdown point.
Until price moves clearly beyond one of these levels, expect uneven, range-bound trading with sharp moves during the day.
This analysis is for educational purposes only and does not constitute trading advice. Futures trading involves significant risk and may not be suitable for all investors.