

Introduction
Crude oil continues to trade in a clear short-term uptrend, and the latest price action is starting to confirm that buyers are still in control.
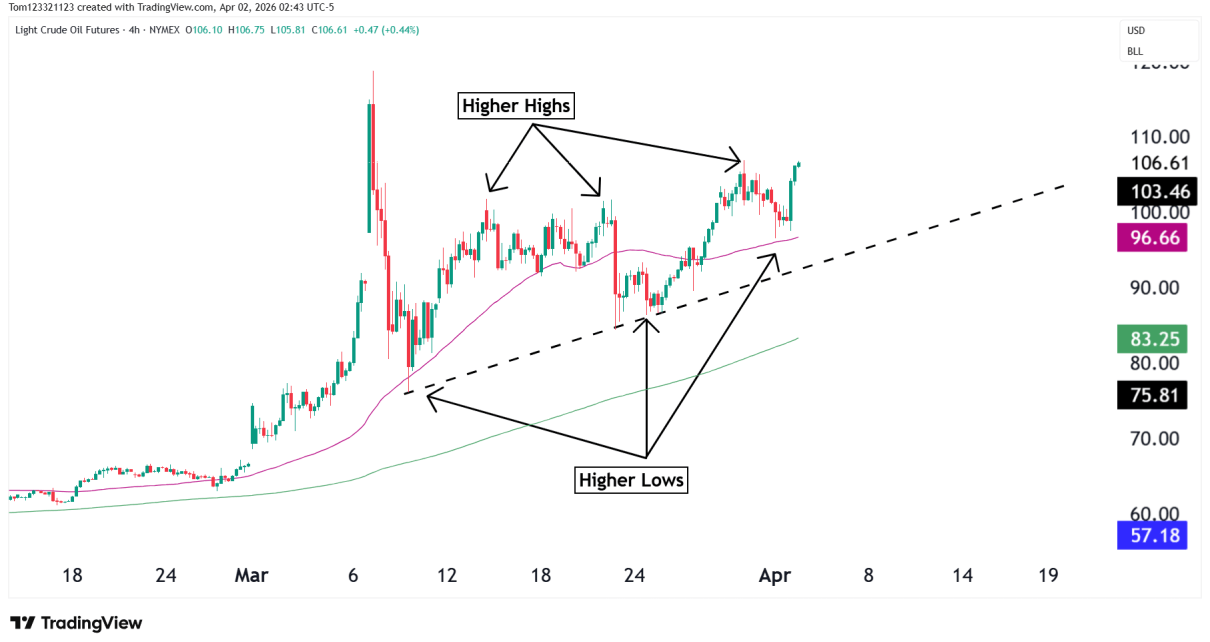
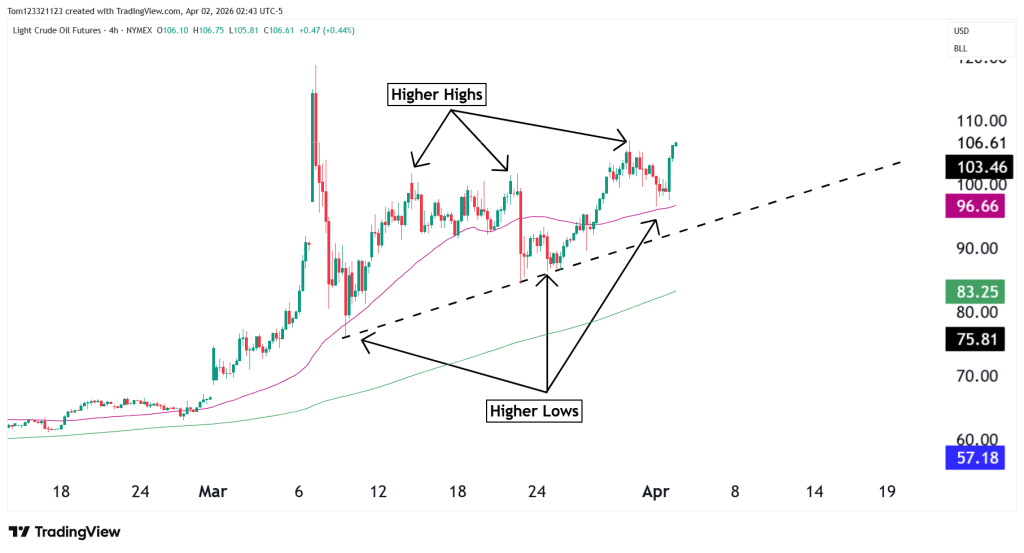
On the 4H chart, the structure is clean: higher highs and higher lows, with price consistently finding support on pullbacks. The recent dip into the 96–100 area held well, and the market has now pushed back toward the highs near 106.
Donald Trump recently gave a speech about the conflict in the Middle East, and he failed to convince that there was a plan for de-escalation, and the market responded with a 8% spike in the Oil price overnight.
This market is heavily dependent on the war, and with the Strait of Hormuz still closed, petrol prices are going up around the world. Some analysts expect oil to be $200. Lets see what the technicals are telling us now.
Market Structure and Price Behavior
Pullbacks have been shallow and controlled, and price has respected both the rising trendline and the 50-period moving average. Each time the market pulls back, it finds support slightly higher than before, paining higher lows on the chart.
The move back above 103–104 is also important. That area acted as resistance during the recent consolidation, and reclaiming it shifts momentum back to the upside.
At the same time, price is now approaching the recent highs again after the spike to $120. There could be some resistance here, but today’s session will give more guidance on the movement as the market digests Trump’s speech.
The most important support zone sits around 100–103. This area lines up with prior structure and the trendline. As long as price holds above it, the uptrend remains intact.
Below that, 96–97 is the next key level. A move back into that area would start to weaken the current structure.
Scenarios and Probabilities
| Scenario | Description | Estimated Probability |
|---|---|---|
| Bullish Continuation | Break above 106–108 → move toward 110+ | 55% |
| Pullback Within Trend | Dip into 100–103, then continuation higher | 30% |
| Deeper Correction | Break below 100 → move toward 96 | 15% |
Possible Trades
The cleaner setups remain with the trend.
Pullbacks into the 100–103 zone are still the most attractive area for longs, especially if price shows signs of holding that level. That aligns with both structure and trend support.
If price breaks above 106–108, momentum traders may look for continuation toward 110+, but ideally with some consolidation first rather than chasing a breakout.
On the short side, there’s not much edge unless the structure breaks.

