

- Volume analysis shows a slight decrease in market participation.
- Price finding support at the ascending diagonal support line, indicating a strong foundation for a potential long trade.
- Targeting the all-time high of 36,836, with the condition that price remains above the crucial support level of 33,790.
Introduction
In today’s technical analysis, we will examine the recent trends and indicators surrounding Dow Jones Futures. By analyzing volume, price action, moving averages, and potential price targets, we can gain valuable insight into a potential long trade in YM.
Volume Analysis:
Observing the current price action, there is a slight decrease in volume. While this may indicate a temporary dip in trading interest, it is crucial to monitor whether this decline continues. Volume serves as a key indicator of market participation and can provide insights into the sustainability of price movements. If we notice a ‘pick-up’ in volume, then we can suspect a high probability of a rally.
Price Support and Bullish Candlestick:
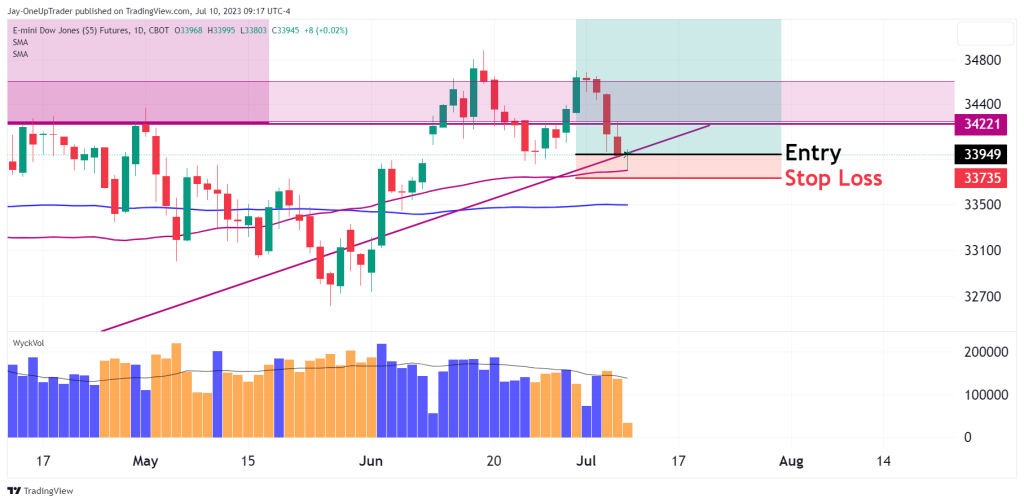
The ascending diagonal support line plays a significant role in providing a strong foundation for the price. Price action has found support at this trendline for the time being, but we have to wait to see the closing price at the end of the day for more accuracy. If we notice a bullish candlestick formation, there is a potential long trade we can take with a stop just below the low. See the chart below for an example.
Moving Averages:
The 50-day moving average (MA) holds above the 100-day MA. This is an additional reason bullish momentum could continue. We can also note the higher highs on the daily chart at each swing.
Bullish Price Target:
With the ascending trendline holding as support and the bullish signals in place, a reasonable price target to consider is the all-time high of 36,836. However, it is crucial for the price to remain above the level of 33,790 to sustain the bullish momentum and validate the target.
Conclusion:
YM technicals give us a bullish bias for the time being. The ascending diagonal support line, bullish candlestick, and the alignment of moving averages all point towards a higher probability of an uptrend in price. With the all-time high of 36,836 as a bullish price target, traders should closely monitor the price’s ability to remain above the critical support level of 33,790.
