

Introduction
Bitcoin futures have suffered a sharp and violent selloff, erasing months of gains in a matter of weeks. After topping near the $125,000 area, BTC collapsed more than 50% at its worst point before finding temporary stabilization near long-term support.
Like with all cryptocurrency moves, it was a volatile one, and panic selling set in. These big drops can provide good opportunities for swing and day traders, but when markets are barely moving, short-term traders generally find it more difficult. What matters now is whether this drop represents a structural breakdown or a high-volatility correction within a larger cycle.

Market Summary
Primary trend: Big drop
Current market perspective: Deep corrective phase
Key support (line in the sand): 60,000–65,000
Bias-defining level: 88,000–90,000
Risk: Sustained acceptance below long-term support
Why Bitcoin Dropped So Hard
The rally became parabolic
Bitcoin’s run into the $120,000+ region was nearly vertical. Price moved far above both its 50- and 200-day moving averages, leaving little structural support beneath it. When BTC trades like that, the corrections are normally very volatile. BTC does not move like normal equity markets; it has cycles that come with strong directional moves in both directions. Finding BTC trading in a wave-like pattern similar to ES or NQ is rare.
Once momentum stalled near the highs, there was very little technical structure to slow the downside.
Risk appetite shifted across markets
Bitcoin fell as markets took another look at a few key factors. Investors questioned when and how fast interest rates might be cut. Inflation data stayed stubborn, real yields moved higher, and the U.S. dollar saw a short-term bounce.
Profit-taking after a historic run
This recent Bitcoin rally lasted roughly 3 years, so profit-taking was becoming inevitable. Usually, when the market is stretched like that, it means any catalyst can send the price crashing. Traders and investors hold onto their positions for too long, and then once the price starts dropping, panic sets in, and it accelerates, creating a snowball effect.
Market Structure & Trend
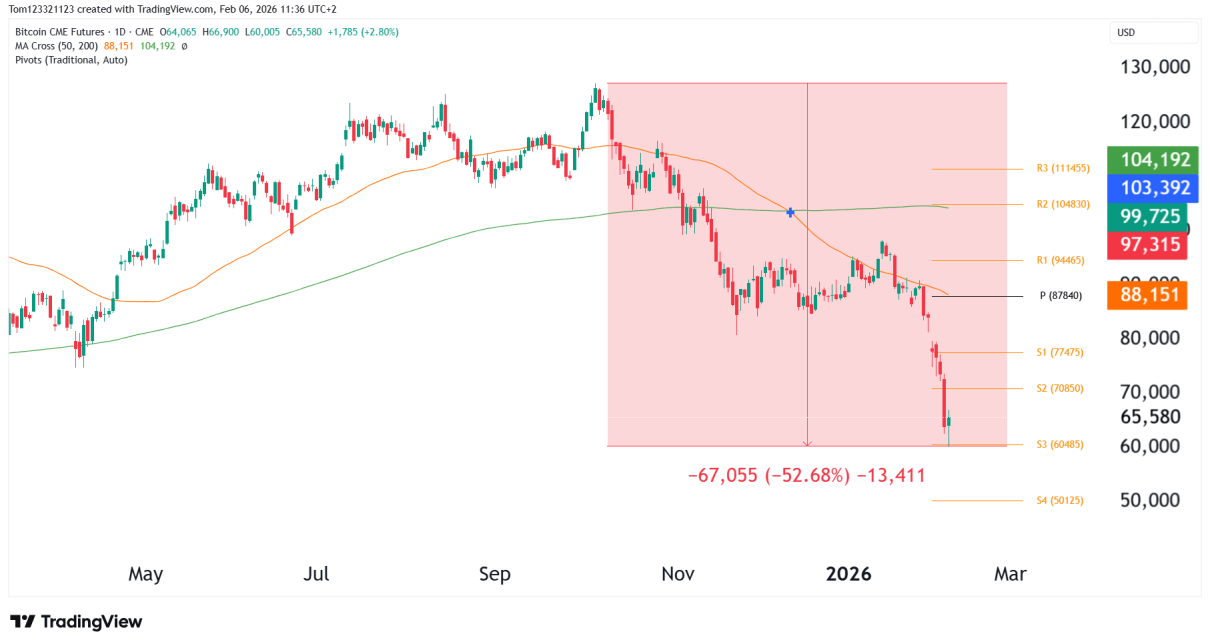
Daily Chart
Weekly Chart
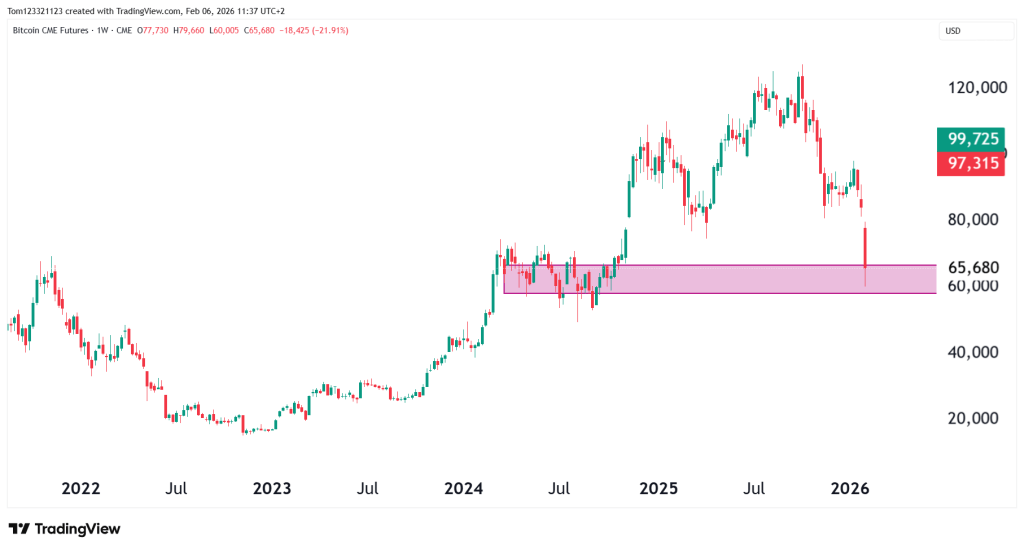
Even after the sharp selloff, Bitcoin is still holding an important support area around $60,000 to $65,000. Earlier in the bull market, this same zone acted as resistance, so it’s a level many traders are watching closely.
If Bitcoin stays above it, the bigger bullish picture is still intact. If it breaks below, that would point to a much deeper change in market conditions. For now, the market looks shaken, but it hasn’t fallen apart.
Key Technical Levels
Line in the Sand
$60,000–65,000:
This is the most important level on the chart. As long as BTC holds above this zone on a weekly closing basis, the long-term uptrend remains intact.
Levels That Shape the Bias
$88,000–90,000:
This area lines up with former support, the 50-day moving average, and prior consolidation. Reclaiming it would be the first real sign that downside momentum is easing.
Reference and Extension Levels
$50,000–52,000:
Next major downside reference if current support fails.
$105,000–110,000:
Upper resistance zone if BTC manages to repair structure and recover.
Looking Forward: Scenarios
Structural Repair (35%)
Bitcoin holds above $60,000, builds a base, and slowly works back toward the $88,000–90,000 area over time.
Volatile Consolidation (40%)
BTC remains range-bound between $60,000 and $90,000 as leverage resets.
Deeper Breakdown (25%)
A sustained break below $60,000 opens risk toward the low-$50,000s and delays the bull-cycle narrative.
Final Takeaway
The 50% drop in Bitcoin means that from here, there will need to be a stabilization if bulls are hopeful that price can start pushing back toward the 100K level. The support zone at $60,000 is a crucial level to hold, a drop below this probably ends the bull market narrative altogether.
Interest rates & monetary policy are the two main things that the markets would be watching now.
This analysis is for educational and informational purposes only and does not constitute trading advice or a recommendation to buy or sell any futures contracts. Futures trading involves significant risk and may not be suitable for all investors. Always conduct your own research and consult with a licensed financial professional before making trading decisions.

