The chart provided displays the U.S. Dollar Index (DXY) on a weekly timeframe. Let’s analyze the technical indicators and identify potential bearish/short high-probability trade opportunities.

Technical Analysis
Descending Triangle Pattern: There is a symmetrical triangle formation. The price recently broke below the lower trendline of this triangle, signaling a potential continuation of the downtrend since mid 2022.
Moving Averages:
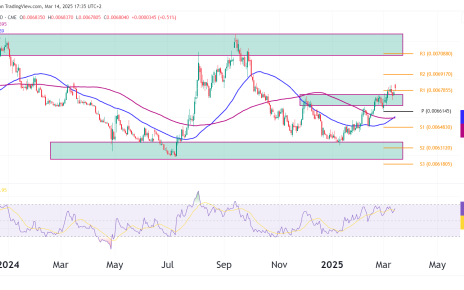
- The 50-week moving average (in pruple) is at 104.249.
- The 200-week moving average (in blue) is at 101.394. The price has recently broken below the 200-week moving average, which is a significant bearish signal. This breakdown tells us that long-term momentum is turning negative.
Pivot Points: The price is currently below the pivot point at 102.048, which is now likely to act as resistance. The next key support levels to watch are S1 at 98.158, S2 at 94.983, and S3 at 90.388.
All-Time High (ATH) Reference: The previous ATH is marked at 114.789, far above the current levels, indicating that the current downtrend is well-established and significant resistance exists above.
Recent Price Action: The recent price action shows a strong bearish candle breaking below the key support of the triangle and the 200-week moving average. This indicates strong selling pressure and a shift in sentiment towards the downside.
Bearish/Short High-Probability Trade Setup:
- Entry Point: A short position could be considered on any retest of the broken support around 102.048 (now resistance). If the price fails to reclaim this level and shows bearish price action (e.g., a bearish engulfing pattern or rejection candle), this would be a strong signal to initiate a short trade.
- Initial Target: The first target for this short trade would be the S1 level at 98.158. This is the nearest support level and could provide a bounce or temporary consolidation.
- Extended Targets: If the bearish momentum continues and the price breaks below S1, the next targets would be S2 at 94.983 and then S3 at 90.388. These levels represent significant potential downside and could be key areas to take profits.
- Stop Loss: To manage risk, a stop loss should be placed just above the 200-week moving average or the broken trendline of the triangle (around 102.5). This placement allows for a margin of error in case of a brief spike above the resistance before continuing lower.