


Introduction
The S&P 500 (ES) chart, along with other US indices, recently had a correction of around 10% from the high. Some are calling this to be a simple pullback, while others think it’s the signal of much worse things to come.
Violent and concerning geopolitical concerns worldwide are likely contributing to the recent profit-taking. Even Bitcoin dropped a whopping 32% from its high during this sell-off. Venezuela, The UK, Gaza, Ukraine, Paris, Lebanon, and Iran are all in turmoil, and its driving market sentiment.
Technical Analysis
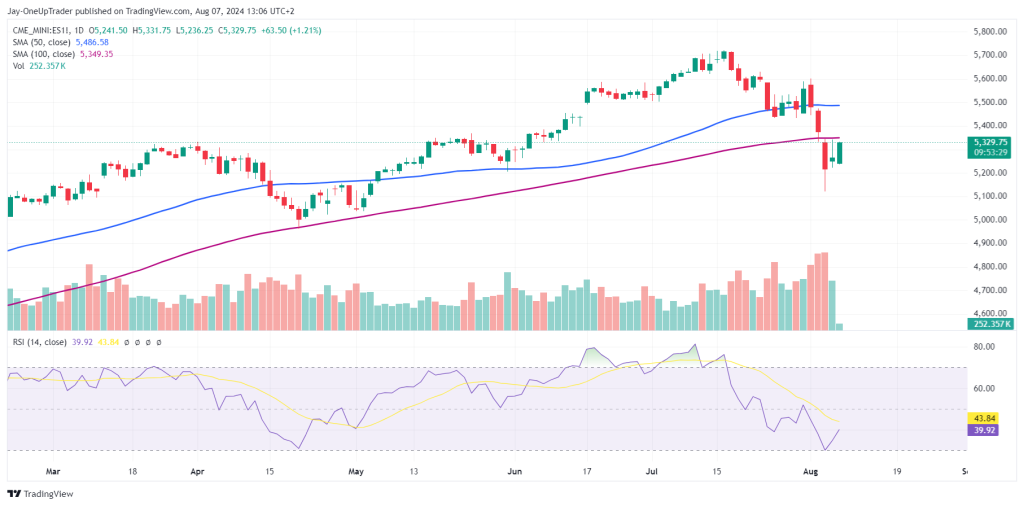
The recent pullback has seen price retrace into the 50 and 100 SMA zone. This can be a strong support area if there is a prevailing uptrend. The RSI also touched oversold, and the candles are forming a bullish-looking morning star pattern.
If we see the price close in the green today, it could be the start of a new run-up to the previous high at $5,700.
Long Trade Setup:
- Entry Point: If the price maintains above the 100-day SMA and shows a confirmed bullish candle.
- Target: Initial target near the 50-day SMA, with a potential extended target around the recent high near 5,700.
- Stop Loss: Below the recent low at 5,180 to protect against further downside.
If you have any technical analysis or a great trade you took with an explanation of your process, please send it to us via our Instagram here or email [email protected] or [email protected]. The trader who sends the best analysis/trade that week will receive a 25% discount code to use on any Evaluation.