

Introduction
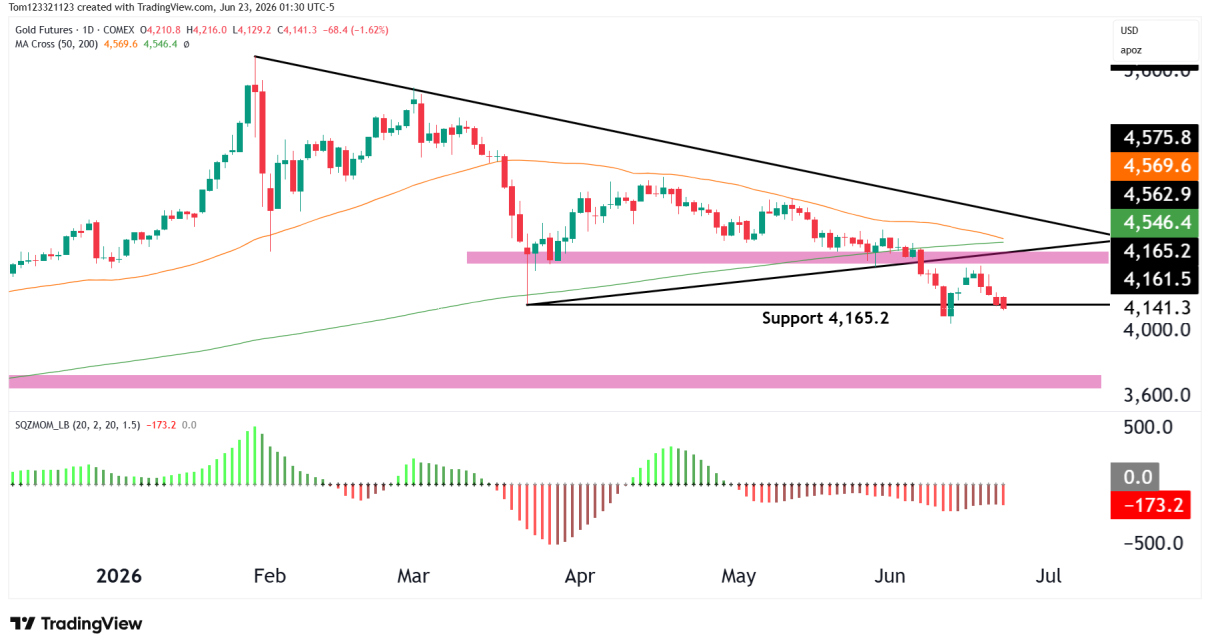
Gold futures continue to follow the bearish roadmap we have outlined throughout June. In our June 10 and June 17 analyses, we looked at how the breakdown below the 4,400–4,450 support zone shifted control firmly toward sellers and exposed the March swing low near 4,165.
While buyers initially managed to hold this support, the rebound lacked conviction, and we saw the GC price drop. The question now is whether 4,165 is going to hold or we will see the price drop further. If the selling pressure increases from here and we see price drop further, there is no real support level until $3,700.
Let’s take a closer look at the technicals and see if there are any trades possible.
Gold Futures Trend Analysis

Estimated Probabilities for Gold Futures
| Scenario | Estimated Probability | Market Interpretation |
|---|---|---|
| Breakdown below 4,165 support | 50% | Sellers maintain control and extend the correction |
| Consolidation between 4,100 and 4,250 | 35% | Market stabilizes after the recent decline |
| Recovery back above 4,400 resistance | 15% | Buyers regain momentum and weaken the bearish structure |
Key Support and Resistance Levels
Major Resistance Levels
- 4,250
- 4,400–4,450
- 4,546–4,570 (200-day and 50-day moving averages)
Major Support Levels
- 4,165
- 4,000 psychological support
- 3,500–3,600 longer-term demand zone
Gold Futures Possible Trades
Bearish Continuation Trade
This remains the dominant setup. As long as Gold continues trading beneath the former support zone and below both major moving averages, sellers maintain the technical advantage. A decisive break beneath 4,165 could open the door for a move toward 4,000.
Support Reaction Trade
The March swing low remains an important decision point. Buyers have already defended this area several times, and another short-term bounce cannot be ruled out. However, bulls need to produce stronger follow-through than previous attempts.
Recovery Trade
For the outlook to improve meaningfully, Gold would need to reclaim the 4,400–4,450 region. That level previously acted as support for nearly two months and now represents the first major resistance zone on the chart.
This analysis is provided for educational and informational purposes only and should not be considered financial or trading advice. Trading futures, forex, and other leveraged financial instruments carries a high level of risk and may not be suitable for all investors. Past performance is not indicative of future results. Before making any trading decisions, conduct your own research, assess your risk tolerance, and consult with a qualified financial advisor if necessary.