


Introduction
Gold has clearly shifted out of its prior strong uptrend and is now in a corrective phase. To put it in perspective, GC has rallied over 140% since Feb 2024. Undoubtedly, there have been a lot of people who have made a profit in the yellow metal, and now the profit-taking is getting strong.
The market is still bullish in the long term, and it could be the time for bulls to start accumulating again. Let’s take a look at the technicals and see if this is a consolidation or if we could see a stronger move downward.
Technical Analysis
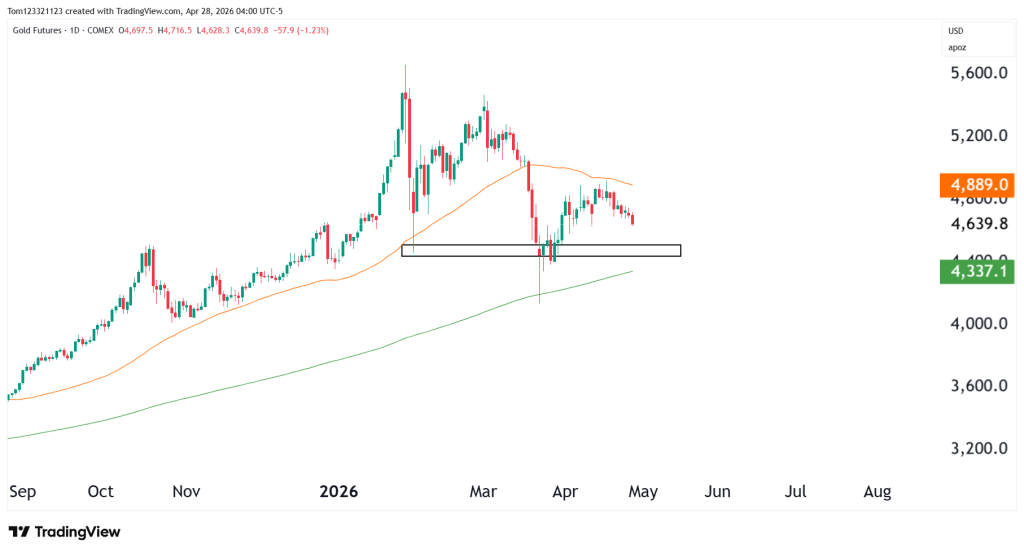
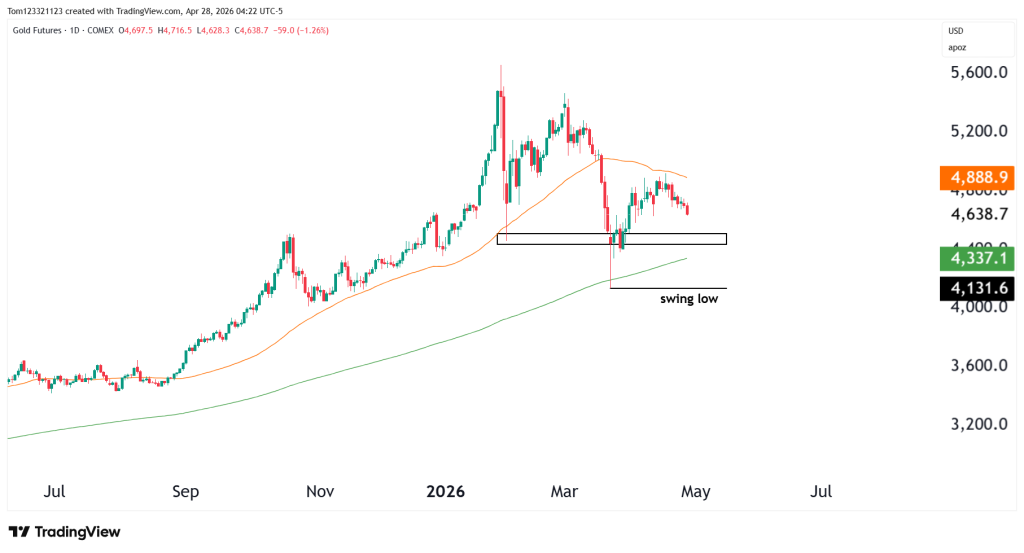
The important level to watch is the support zone at $4,500. This will need to hold in order to keep the bullish narrative in place. A break below that brings the 200 MA into the picture. Price is currently trading below the 50 moving average and in between the zone of the two ma’s.
Looking at the price action on the daily chart, it looks like a standard consolidation, and there is no real change in trend at the moment. There is a swing low at $4,131.6. If that level breaks, the trend would shift to bearish and we would likely see a lot of selling pressure enter the market.
Scenarios and Probabilities
| Scenario | Description | Estimated Probability |
|---|---|---|
| Consolidation | Holds support and trades sideways | 50% |
| Breakdown | Loses support → move toward ~4,131 | 25% |
| Recovery | Reclaims 4,800+ → trend stabilizes | 25% |
Possible Trades
Longs only really make sense if price shows a clear reaction at support, with stronger candles and follow-through. Without that, buying here is a gamble.
A cleaner long would come either from:
- A strong bounce off this zone
- Or a reclaim of the 4,800 area
Shorts become more interesting if price breaks below 4,450 with momentum.
What Could Move Gold
1. PCE Inflation (April 30)
2. Non-Farm Payrolls (May 1)
3. Federal Reserve (May 6–7)
4. Treasury Yields
5. Dollar (DXY) Gold and the dollar often move in opposite directions.
6. Geopolitics (Middle East)
Final Takeaway
In short, the market is at a key level and the next move will likely come from how price reacts around support. As long as that zone holds, this looks like a normal pullback within a larger uptrend.
If it breaks, then the structure changes and lower prices come into play. Until then, it’s a waiting game. Let price confirm before taking any positions.
This analysis is for educational and informational purposes only and does not constitute trading advice. Futures and forex trading involve significant risk and may not be suitable for all investors. Always conduct your own research before making trading decisions.