


Introduction
Bitcoin is no longer in an uptrend. The structure has clearly shifted over the past few months and the question now is whether price is going to find support at the current level and claw its way back up or if its going to continue downward.
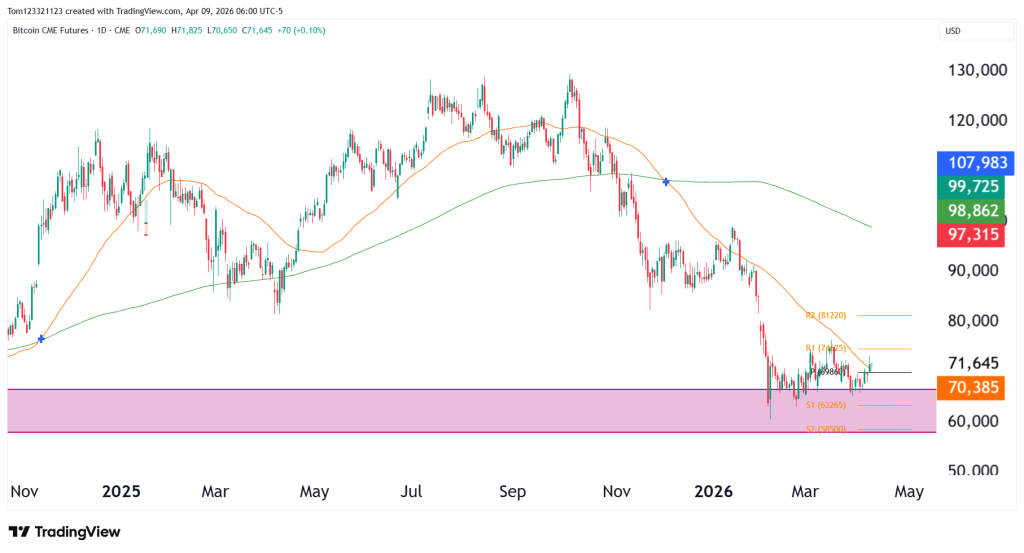
After topping out near the 120K–130K area, BTC rolled over and broke down aggressively, losing both the 50-day and 200-day moving averages. That move led to a sharp selloff into the 60K–65K support zone, where price is now trying to stabilize.
Key Levels That Matter
The most important support remains the 60K–65K zone. This area held the selloff and is acting as the current floor.
The pivot points on the daily chart will be important to watch moving forward, particularly the pivot point at 69860, support 1 at 63265, and resistance 1 at 74625.
Is the Middle East Conflict Affecting BTC?
Unlike oil or equities, BTC’s reaction has been muted and indirect.
Here’s what stands out:
- The ceasefire boosted risk assets (like equities), but BTC did not show the same strong follow-through
- BTC remains more tied to its own cycle and liquidity conditions than short-term geopolitical headlines
- During the initial risk-off move, BTC sold off—but that was already in line with its broader downtrend
So while macro sentiment does have some influence, BTC is not being driven directly by the Middle East situation.
Scenarios and Probabilities
| Scenario | Description | Probability |
|---|---|---|
| Range Continuation | Price holds between 60K–75K | 50% |
| Bearish Continuation | Break below 60K → move toward 55K or lower | 30% |
| Bullish Recovery | Break above 75K → move toward 80K+ | 20% |
This analysis is for educational and informational purposes only and does not constitute trading advice. Futures and forex trading involve significant risk and may not be suitable for all investors. Always conduct your own research before making trading decisions.

