

Introduction
A moving average is a widely used indicator in technical analysis that helps smooth out price action by filtering out the “noise” caused by random price fluctuations. It is considered a trend-following, or lagging, indicator because it is based on past price data rather than predicting future movements.
The two most common types of moving averages are the simple moving average (SMA) and the exponential moving average (EMA). The SMA calculates the average price of a security over a set number of periods, while the EMA places more weight on recent prices, making it more responsive to current market conditions.
Moving averages are most often used to determine trend direction and identify potential support and resistance levels. While they are effective on their own, they are also a key component in other technical indicators, such as the Moving Average Convergence Divergence (MACD).
The main purpose of a moving average is to identify trends, spot potential reversals, measure the strength of price movement, and highlight areas where an asset may find support or resistance.
There are many ways traders can use moving averages in the market. Below are some practical strategies you can apply.

Trend
Identifying trends is one of the key functions of moving averages. Because moving averages are lagging indicators, they do not predict new trends but instead confirm trends once they are already established.
As shown in the diagrams below, a market is generally considered to be in an uptrend when the price is trading above a moving average and the moving average itself is sloping upward. This indicates sustained buying pressure and a strong directional move.
Conversely, when the price is below a downward-sloping moving average, it signals a downtrend. In this case, sellers are in control, and price is more likely to continue moving lower.
Many traders use a simple rule: only look for long positions when the price is above a moving average, and short positions when the price is below it. This helps align trades with the overall trend and increases the probability of success rather than fighting it.
Momentum
Many new traders want to understand how momentum can be measured and how moving averages can be used to do this. The key is to pay close attention to the time periods used to calculate the moving average, as each period reflects a different type of momentum.
Short-term momentum can be gauged using moving averages based on 20 periods or less. Moving averages calculated over 20 to 100 periods are commonly used to measure medium-term momentum, while those using 100 periods or more help identify long-term momentum.
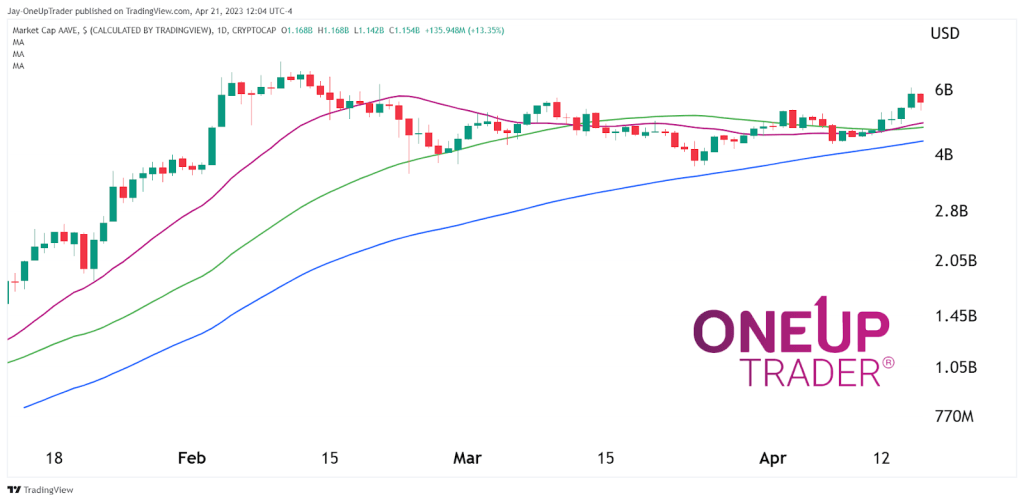
One of the most effective ways to analyze momentum is by using multiple moving averages on the same chart. By comparing how they interact, traders can better understand both the strength and direction of an asset’s movement.
A common setup includes the 20, 50, and 100 moving averages, which represent short-, medium-, and long-term trends. When all three moving averages are positioned below the price, it typically indicates a strong uptrend. However, when shorter-term averages, such as the 20 moving average, begin to cross below longer-term averages like the 50, it can signal weakening momentum. This often leads to a period of consolidation, which is important for traders to recognize when analyzing market conditions.
Support
Moving averages are also widely used as dynamic support levels in the market. Unlike horizontal support, which is fixed, moving averages adjust over time as price changes, making them more flexible and responsive to current market conditions.
It doesn’t take much experience to notice that when the price of an asset is trending upward, pullbacks often slow down or reverse near a key moving average. This is because many traders watch these levels and place buy orders around them, creating a reaction in price.
For example, during a strong uptrend, the 20-day or 50-day moving average will often act as support. Price may test the moving average multiple times without breaking below it, confirming its strength. Each successful bounce can reinforce trader confidence and lead to the continuation of the trend.
Many traders anticipate a move after price interacts with a moving average. A bounce from support is often used as a signal to enter a trade in the direction of the trend. However, these setups are rarely used in isolation. Traders will typically combine moving averages with other technical indicators, such as the RSI or MACD, to confirm the strength of the setup.
It’s also important to understand that support from a moving average is not guaranteed. If price breaks below a key moving average with strong momentum, it can signal a potential trend shift or deeper pullback. For this reason, traders should always manage risk and avoid relying on a single indicator.
Resistance
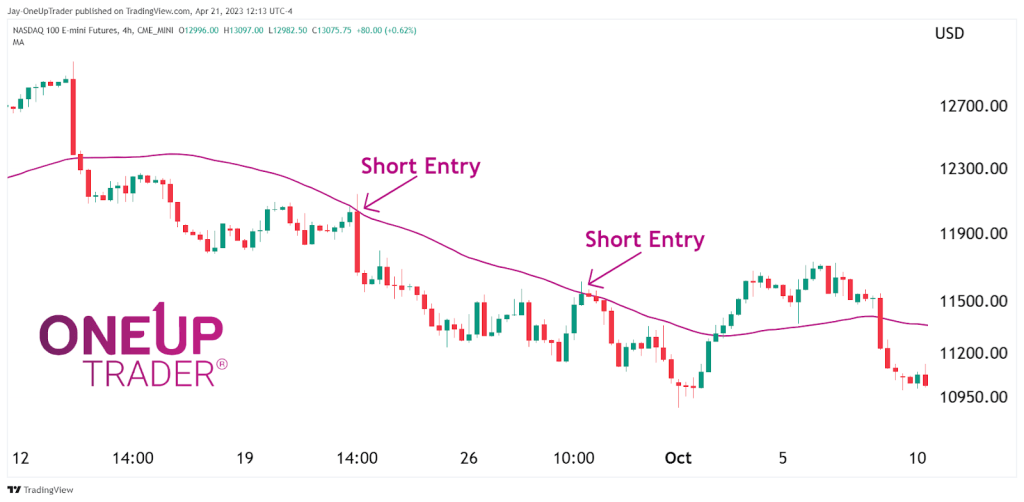
The same concept applies to resistance, but in the opposite direction. In a downtrend, where the market is forming lower highs and lower lows, moving averages can act as dynamic resistance levels.
As price pulls back during a downtrend, it will often rise toward a key moving average before rejecting and continuing lower. This happens because traders use these levels to enter short positions or add to existing ones, creating selling pressure around the moving average.
For example, a 20, 40, or 50 moving average can act as resistance in a strong downtrend. Price may test the moving average multiple times but fail to break above it, confirming the strength of the trend. Each rejection from the moving average can provide an opportunity to enter a short position in line with the overall market direction.
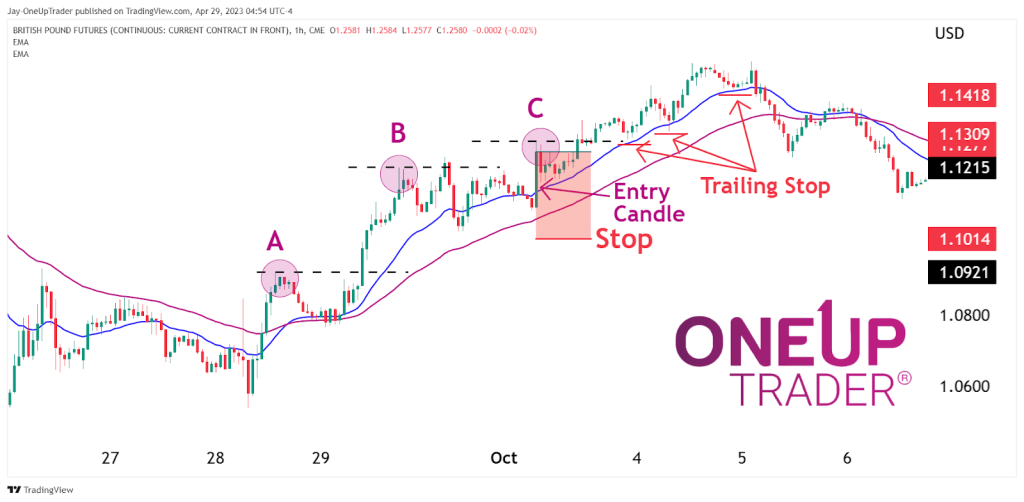
Moving averages can also be used to trail stop-losses in short trades. As the trend continues downward, traders may move their stop-loss just above the moving average to lock in profits while allowing the trade room to develop.
However, just like with support, resistance from a moving average is not guaranteed. If price breaks above a key moving average with strong momentum, it may signal a weakening downtrend or a potential reversal. For this reason, traders should always look for confirmation and manage risk carefully.
Moving Averages As Stop-Losses
Moving averages can also be used to set stop-loss levels, as mentioned earlier. However, there is an important drawback that traders need to keep in mind: using a moving average as a stop-loss can go against the basic principle of buying low and selling high.
Because moving averages are lagging indicators, they do not react quickly to sudden reversals. This can result in giving back a portion of profits before the stop-loss is triggered. In fast-moving markets, price may reverse sharply while the moving average is still catching up.
Another common issue is that normal pullbacks within a trend can test the moving average and trigger the stop-loss prematurely. In many cases, the market may briefly dip below the moving average, take out stops, and then continue in the original direction.
Despite these drawbacks, moving averages can still be effective for managing trades, especially over the longer term. When used correctly, they can help traders stay in trends and avoid exiting positions too early.
The key is to match the moving average to the strength and timeframe of the trend, while also applying proper risk management. Avoid placing stop-losses too close to the current price, as this increases the chances of being stopped out during normal market fluctuations.
Simple Moving Averages
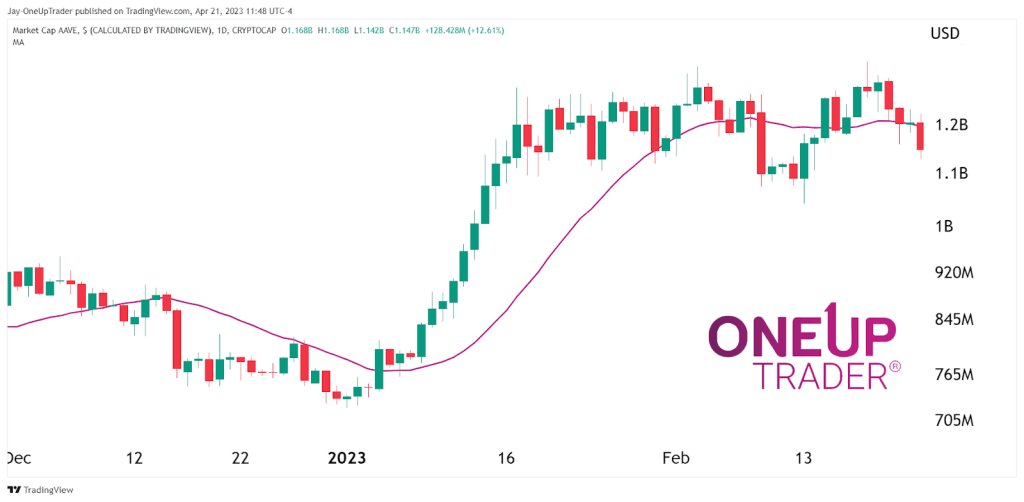
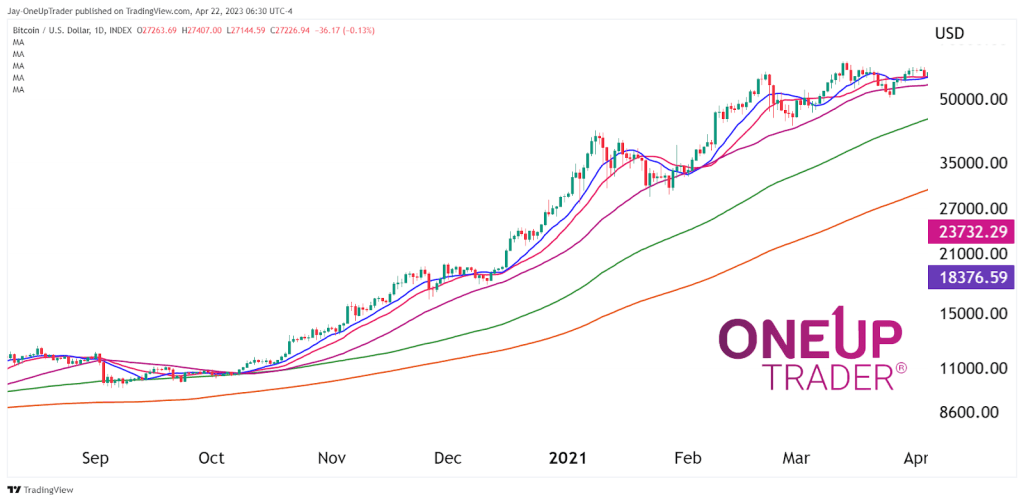
A simple moving average is calculated by adding the closing price of a security for a number of time periods and then dividing this total by the number of time periods. Short-term averages respond quickly to changes in the price of the security, while long-term averages are slow to react.
The chart below illustrates that shorter moving averages track the market much more closely than longer-term ones. This chart also demonstrates how too many moving averages cause clutter on a chart which makes the actual price action difficult to observe. A simple moving average can be used for long-term charts such as the daily, weekly, and monthly. And it is not as effective in shorter time frames.
Exponential Moving Averages
An exponential moving average (EMA) is similar to a simple moving average, but it gives more weight to recent price data. This makes it more responsive to current market conditions and quicker to react to price changes.
EMAs are generally more useful on shorter timeframes, as they adjust faster than simple moving averages. For traders who want a moving average that closely follows price action, the EMA is often the preferred choice. However, on higher timeframes such as daily, weekly, or monthly charts, this increased sensitivity can sometimes make EMAs less reliable due to market noise.
SMA vs EMA: What’s the Difference?
The main difference between a simple moving average (SMA) and an exponential moving average (EMA) lies in how they respond to price changes.
A simple moving average treats all data points equally, which makes it smoother and slower to react to price movements. This can be useful for identifying long-term trends and filtering out short-term market noise.
An exponential moving average, on the other hand, gives more weight to recent price data. This allows it to respond more quickly to changes in the market, making it more suitable for short-term trading and faster decision-making.
In general, traders use SMAs when they want a broader view of the market trend, and EMAs when they need a more responsive indicator that follows price action more closely.
Choosing between the two depends on your trading style, timeframe, and how sensitive you want the indicator to be.
Best Moving Average Settings
There is no single “best” moving average, as the ideal settings depend on your trading style and timeframe. However, certain moving averages are widely used because they consistently provide useful signals across different markets.
Some of the most common settings include:
- 20 EMA – used for short-term trends and quick entries
- 50 moving average – used to identify medium-term trend direction
- 100 moving average – used for stronger trend confirmation
- 200 moving average – used to determine long-term market direction
Many traders combine multiple moving averages, such as the 20, 50, and 200, to get a clearer picture of the market. When these moving averages are aligned, they can provide strong confirmation of trend direction.
It’s important to remember that no setting works in all conditions. Traders should adjust their moving averages based on the market they are trading and the timeframe they are using.
Displaced Moving Averages
A displaced moving average (DMA) is a moving average that has been shifted forward or backward in time. This adjustment is used to better align the moving average with price action and reduce some of the noise found in traditional moving averages.
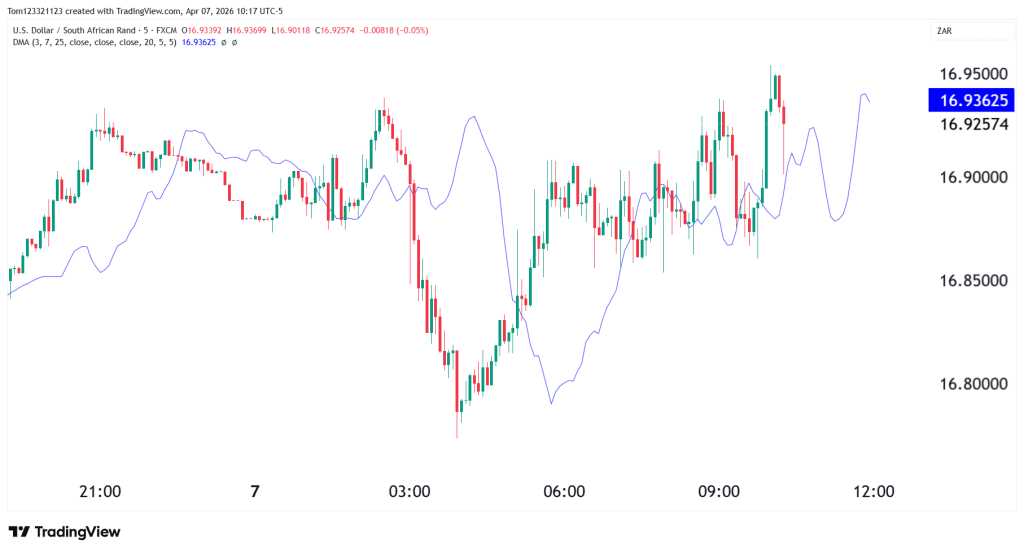
Displaced moving averages are created by taking a standard moving average and shifting it by a set number of periods. If the displacement value is negative, the DMA will lag behind the original moving average. If the value is positive, it will be shifted forward, effectively leading the original moving average.
The goal of using a DMA is to improve how the moving average fits with price movement. By shifting the indicator, traders can sometimes identify trends more clearly or spot potential turning points earlier. Some traders believe this makes displaced moving averages more effective than standard SMAs or EMAs, although this depends heavily on how they are used.
DMA works by allowing traders to view trends slightly earlier or later than with traditional moving averages. To use a displaced moving average effectively:
- Choose your timeframe (daily, weekly, etc.)
- Select the type of moving average (SMA or EMA)
- Set the displacement value (number of periods forward or backward)
- Plot the DMA on your chart alongside price action
Traders typically look for price crossing above or below the displaced moving average as a potential signal. However, like all indicators, these signals should be confirmed with other tools such as support and resistance levels. Proper risk management, including the use of stop-loss orders, is essential.
Strategies for Trading Using Moving Averages
There are many ways to use moving averages in trading. The strategies below are simple and can be adapted to suit different styles and markets.
It is important to remember that no strategy works without proper risk and money management. Even the best setups will fail without discipline and consistent risk control.
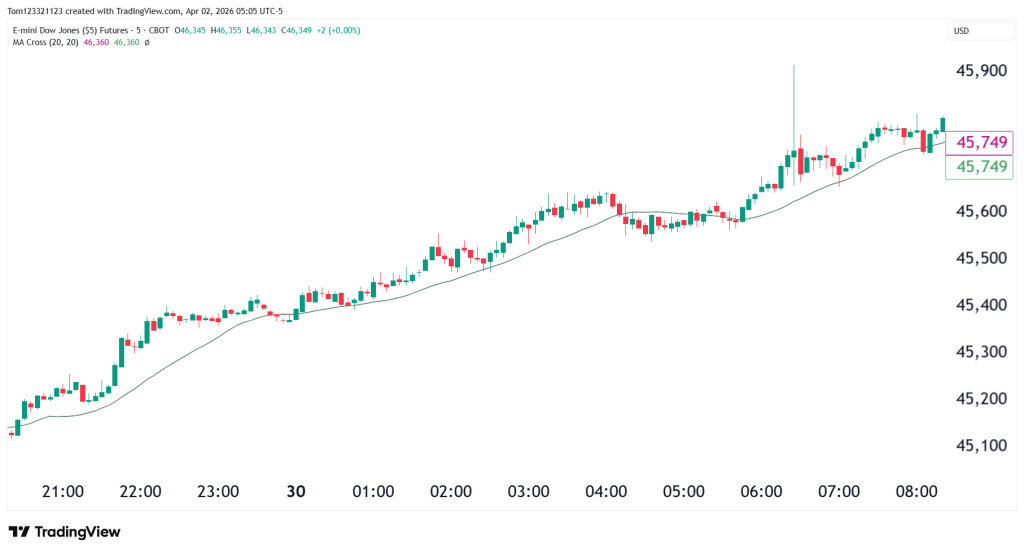
The Pullback Strategy
In this strategy, two or more moving averages are used to create a “zone” or band on the chart. When the moving averages begin to diverge and create space between them, traders wait for price to pull back into this zone before looking for an entry.
This is a simple but effective strategy that requires patience and discipline.
It works best in trending markets, so the first step is to confirm that a valid trend is in place. One way to do this is by identifying market structure. In an uptrend, the market should form higher highs and higher lows.
For example, using a 20 and 50 EMA, you may notice that the moving averages begin to separate as the trend strengthens. When price retraces back into the zone between the two averages, it can provide a potential entry point.
A trade could be taken after confirmation, such as a strong bullish candle. A stop-loss can be placed a few points below the recent low, while profit targets can be set using a 1:1 or 1:2 risk-to-reward ratio. Alternatively, traders may choose to trail their stop-loss below each higher low as the trend continues.
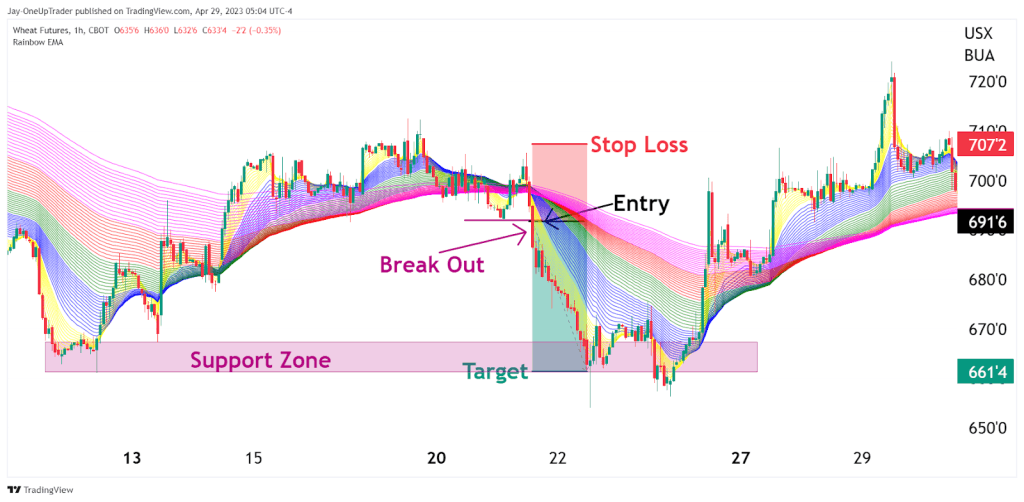
Break Out Ribbon Strategy
In this strategy, a series of moving averages are applied to the chart to form a “ribbon.” This ribbon helps visualize periods of consolidation and potential breakout opportunities.
When the moving averages begin to converge into a tight range, it usually indicates that the market is losing momentum and entering a consolidation phase. During this time, traders should mark the most recent swing high and swing low, as these levels become key areas to watch.
A trade is triggered when price breaks out of this range. If price breaks above the swing high, it signals a potential long entry. If price breaks below the swing low, it signals a potential short entry.
In the example below, the moving averages converge, showing consolidation, and the most recent swing low is broken. This would provide a short entry signal, as it suggests that sellers have taken control of the market.
Targets for this strategy are typically based on nearby structure levels. For short trades, traders may aim for the next support zone, while for long trades, the next resistance zone can be used as a target. Some traders may also choose to trail their stop-loss as the trade moves in their favor.
Limitations of Moving Averages
While moving averages are powerful and widely used, they are not without limitations. Understanding these drawbacks is important for using them effectively in real market conditions.
One of the main limitations is that moving averages are lagging indicators. Because they are based on past price data, they react slowly to sudden changes in the market. This means traders may enter trades late or exit after a large portion of the move has already occurred.
Moving averages can also produce false signals, especially in sideways or ranging markets. During these conditions, price may frequently cross above and below the moving average without establishing a clear trend, leading to poor trade entries.
Another limitation is that moving averages should not be used on their own. While they are useful for identifying trends and key levels, they work best when combined with other tools such as price action, support and resistance, or indicators like RSI and MACD.
For this reason, traders should treat moving averages as part of a broader strategy rather than relying on them as a standalone solution.
Frequently Asked Questions
What is the best moving average for beginners?
The 50 and 200 moving averages are commonly used by beginners because they clearly show the overall trend and are less sensitive to short-term price fluctuations.
Is EMA better than SMA?
Neither is better in all situations. The EMA is more responsive to price changes, while the SMA is smoother and more stable. The best choice depends on your trading style and timeframe.
What is the 200-day moving average?
The 200-day moving average is a widely used long-term indicator that helps traders identify the overall market direction. When price is above it, the market is generally considered to be in an uptrend.
Do moving averages work in forex and crypto?
Yes, moving averages work across all financial markets, including forex, stocks, and cryptocurrencies. Their effectiveness depends on how they are used within a broader strategy.
Can moving averages predict price movements?
No, moving averages do not predict future price movements. They are lagging indicators that help confirm trends based on past price data.
Final Thoughts
Moving averages are one of the most widely used tools in technical analysis for a reason. They help traders simplify price action, identify trends, and find key areas of support and resistance.
However, like any indicator, they are not perfect. Because moving averages are based on past price data, they should be used as a guide rather than a prediction tool. The most effective way to use them is by combining them with other forms of analysis, such as price action and key market levels.
With practice, moving averages can become a reliable part of your trading strategy. By understanding how they behave in different market conditions and applying proper risk management, traders can use them to make more informed and consistent decisions.
