


Introduction
Dow futures have quietly pushed into new highs above 50,000, continuing one of the most stable uptrends across major U.S. indices. YM has continued in a controlled manner in a more predictable trend than that of ES or NQ. Higher highs and higher lows are easy to spot with little volatility so momentum traders have had an easy ride so far.
The question is how long buyers can maintain control without a deeper reset.
Market Summary
Primary trend: Strongly bullish across higher timeframes
Current market perspective: Breakout into new highs with steady momentum
Key support: 48,800–49,000
Bias-defining level: 50,000
Risk to bullish trend: Sustained break below the 50-day moving average
Why This Matters Right Now
The Dow is often a signal of broader economic confidence. It contains more cyclical, industrial, and value-oriented names compared to tech-heavy indices.
When the Dow leads to new highs:
- It means economic participation is broadening
- It supports the “soft landing / steady growth” narrative
- It reflects capital rotating into stable, large-cap cash flow names
Market Structure & Trend
Monthly Chart
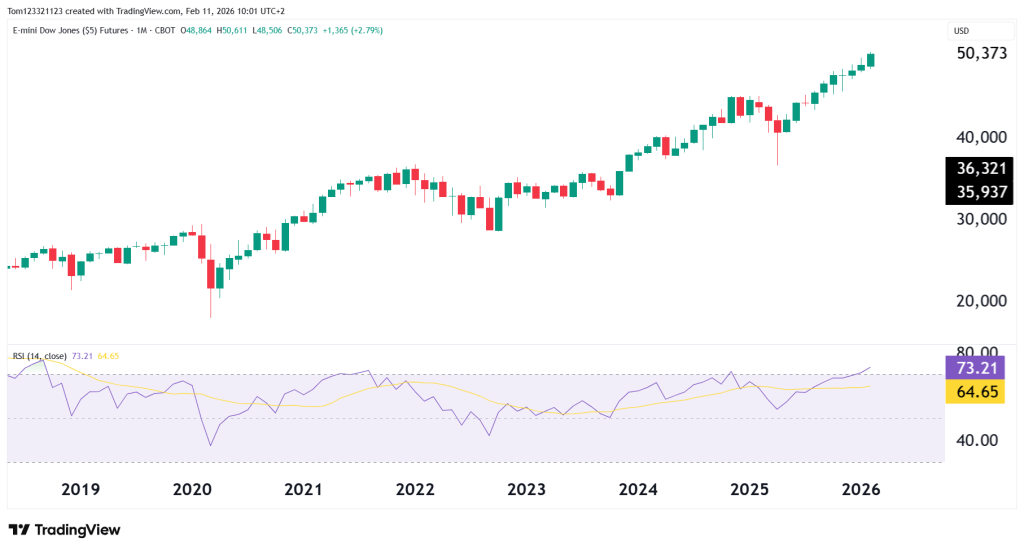
The monthly chart shows a powerful, clean recovery from the 2022 correction, followed by a steady multi-year advance. The last 10 candles/months have all been green.
Key observations:
- Higher highs and higher lows remain intact
- No structural breakdown since 2023
- Momentum (RSI ~73) is elevated but not historically extreme
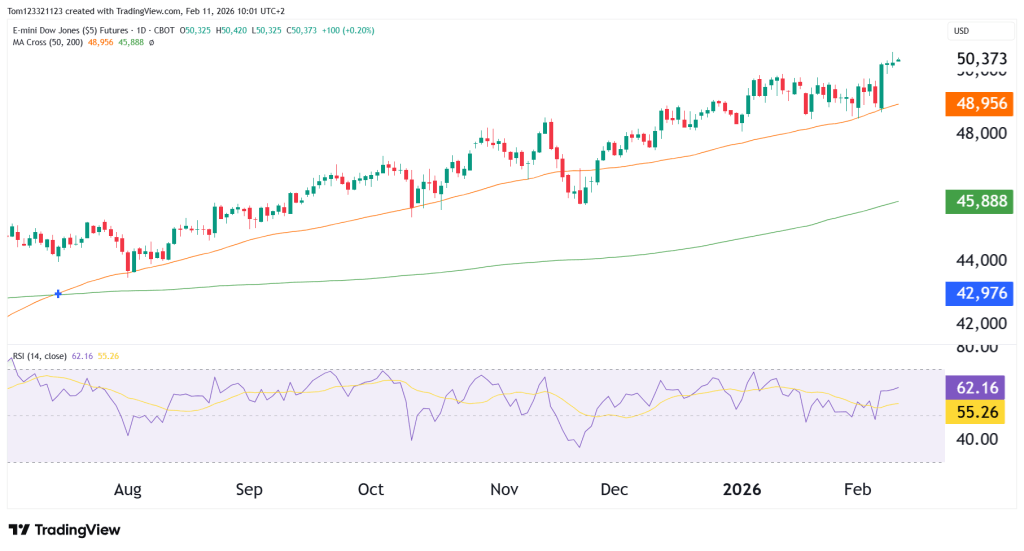
Daily Chart
On the daily timeframe, price continues to respect the rising 50-day moving average (currently near 48,950). Each time price has tested the 50 MA, price has bounced, providing buying opportunities for bulls.
Recent behavior shows:
- Pullbacks finding support above trend
- Higher lows forming consistently
- Resistance near 50,000 being tested and now slightly exceeded
The breakout above 50,000 is technically significant, but what matters more is if it can hold. If price holds above this level rather than quickly rejecting it, the breakout strengthens.
Right now, buyers remain in control.
Key Technical Levels
Line in the Sand
48,800–49,000
This area aligns with:
- Rising 50-day moving average
- Prior breakout structure
- Short-term trend support
As long as price holds above this zone, the uptrend remains intact.
Looking Forward: Scenarios
Bullish Continuation (45%)
Dow holds above 50,000 and grinds higher toward 51,000+ in steady fashion.
Controlled Consolidation (35%)
Price rotates between 49,000 and 50,500 as momentum resets.
Deeper Pullback (20%)
Loss of 49,000 opens a retracement toward 47,500 while preserving the larger uptrend.
This analysis is for educational and informational purposes only and does not constitute trading advice or a recommendation to buy or sell any futures contracts. Futures trading involves significant risk and may not be suitable for all investors. Always conduct your own research and consult with a licensed financial professional before making trading decisions.

