


Introduction
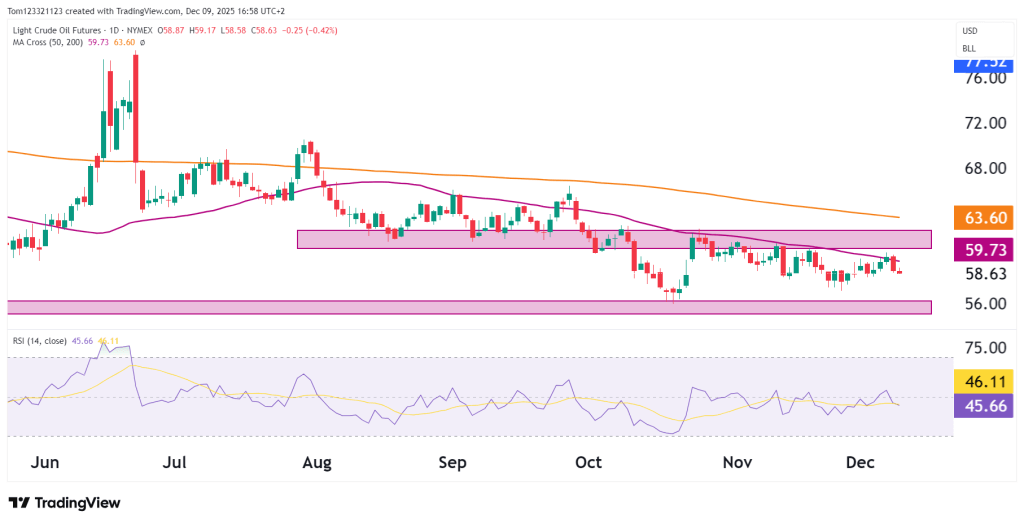
Crude Oil Futures (CL) have encountered resistance at the 50-day moving average, with a bearish engulfing pattern forming in the December 8 session. The RSI has also come down off the 50 line as the selling pressure increases. On the fundamentals side, crude remains sensitive to weekly U.S. inventory data, with traders watching for signs of tightening supply as demand indicators stay mixed globally. OPEC+ policy signals and ongoing Middle East tensions continue to shape the market’s risk premium, while broader macro trends—such as dollar weakness and shifting Fed expectations—may also influence short-term price direction.
Let’s take a closer look at the technicals and what they are telling us.
Technical Overview
Price still capped under resistance
CL remains confined beneath the $59.50–$61.00 resistance band, an area that includes the 50-day moving average (currently near $59.73) and the breakdown zone from October–November. Price briefly tested the region early this week, but momentum faded, and crude has rotated lower again.
This keeps the larger downtrend intact, with the 200-day moving average ($63.60) still declining sharply and well above current price—another sign that medium-term sentiment remains weak.
Range support still holding, but fragile
On the downside, the $56.00–$57.00 zone remains the key support area. This level has repeatedly caught buyers over the past two months, forming a well-defined floor. Any daily close below $56 would expose the broader support cluster near $54.50–$55.50, where buyers stepped in during the late-October washout.
So far, CL is continuing to oscillate inside a horizontal channel between support and overhead resistance, with no confirmed breakout on either side.
RSI shows weak momentum
The RSI (14) sits near 45–46, tracking flat and below its signal line—reflecting weak momentum and lack of strong buying pressure. There is no sign yet of bullish divergence, but the indicator is holding above oversold territory, suggesting crude may continue to chop sideways in the near term.
Key Technical Levels
| Type | Level | Description |
|---|---|---|
| Resistance 1 | $59.50–$61.00 | 50-day MA |
| Resistance 2 | $63.60 | 200-day MA |
| Resistance 3 | $66.00 | September swing highs |
| Support 1 | $57.00–$56.00 | Primary range support |
| Support 2 | $54.50–$55.50 | October lows + major demand |
| Support 3 | $52.80 | Extended downside target if range breaks |
Probability Table (Next 2–3 Weeks)
| Scenario | Estimated Probability | Notes |
|---|---|---|
| Continued range-bound trade ($56–$60) | 55% | Low momentum + repeated failed breakouts. |
| Push into $61–$63.50 resistance | 30% | Requires stronger bids and a close above 50-day MA. |
| Breakdown below $56 → $55 or lower | 15% | Only likely if risk sentiment weakens or supply data spikes. |
Summary
Crude oil remains directionless in the short term, stuck between overhead resistance at $59.50–$61.00 and a well-defined support floor around $56. Price continues to trade below both the 50-day and 200-day moving averages, keeping the broader trend neutral-to-bearish. Until CL can decisively break above $61—or loses support below $56—the market is likely to remain range-bound.
This analysis is for educational and informational purposes only and does not constitute trading advice or a recommendation to buy or sell any futures contracts. Futures trading involves significant risk and may not be suitable for all investors. Always conduct your own research and consult with a licensed financial professional before making trading decisions.

