


Introduction
Crude oil futures are attempting a small rebound as prices climb back toward $59.00. CL has been mainly moving sideways with the bears in slightly more control. In the previous analysis (19 November 2025), we highlighted that CL was stuck between the 50-day moving average and the $56–$57 support zone, with sellers maintaining control so long as oil remained below the key $60–$62 resistance band.
Let’s take a closer look at the technicals and what they are telling us.
Technical Overview

CL Daily Chart Technical Analysis
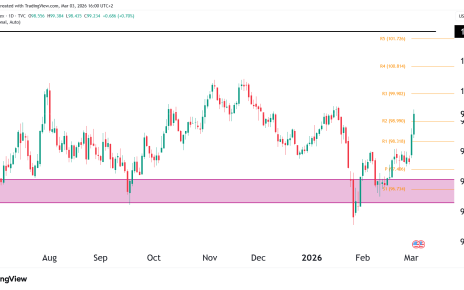
Oil continues to trade in a long-term downtrend, with the price unable to reclaim the 50-day moving average (currently at $60.40). The market bounced from the support zone at $56–$57, an area that has repeatedly attracted buyers since July. However, supply remains obvious overhead.
Price is now pushing back into the $59–$61 consolidation band, a zone that acted as support for months before turning into resistance. This area also overlaps the 50-day MA and sits directly beneath the declining 200-day MA at $64.03, strengthening the bearish bias.
If CL can close above $61.00, momentum may improve enough to retest the early-November highs near $62.50–$63.00, but until that breakout happens, sellers remain in control.
On the downside, any failure at current levels risks another revisit of the $56–$57 support floor, where a breakdown could open the door to a larger bearish continuation toward $54–$55, the lower multi-month demand zone.
The RSI at 47.33 remains neutral-bearish, recovering slightly from oversold conditions but not yet signaling a trend shift.
Key Technical Levels
| Type | Level | Description |
|---|---|---|
| Resistance 1 | $60.40–$61.00 | 50-day MA. |
| Resistance 2 | $62.50–$63.50 | Recent swing highs. |
| Resistance 3 | $64.00 | 200-day MA. |
| Support 1 | $57.00–$56.00 | Primary multi-month support. |
| Support 2 | $54.50–$55.00 | Lower demand zone. |
| Support 3 | $52.70 | Extended bearish target if momentum worsens. |
CL Probability Table (Next 2–3 Weeks)
| Scenario | Estimated Probability | Notes |
|---|---|---|
| Range-bound between $57–$61 | 50% | Market trapped between support and 50-day MA; no breakout confirmation yet. |
| Bullish push toward $62.50–$63.50 | 30% | Requires decisive close above $61 and improving risk sentiment. |
| Breakdown below $56 → move toward $54–$55 | 20% | Could occur if economic data weakens or supply increases. |
Fundamentals
Oil prices have stabilized, supported by improving risk sentiment and a slight pullback in the U.S. dollar. This has offered some short-term relief, but the broader fundamental picture remains mixed.
Global demand concerns are still in play, especially from Europe and parts of Asia, where economic activity continues to lag. U.S. inventory data has also been volatile, with the latest report showing another build — a development that has weighed on bullish momentum.
Geopolitical tensions in the Middle East remain a key risk factor, with the potential to drive prices sharply higher. However, the situation has not escalated further, keeping that risk mostly in the background for now. At the same time, OPEC+ has yet to clarify its production plans, with updated guidance expected in early December.
For now, the lack of strong demand signals and unresolved supply dynamics mean the outlook for crude remains neutral to slightly bearish, unless geopolitical risks begin to intensify meaningfully.
This analysis is for educational and informational purposes only and does not constitute trading advice or a recommendation to buy or sell any futures contracts. Futures trading involves significant risk and may not be suitable for all investors. Always conduct your own research and consult with a licensed financial professional before making trading decisions.
