


Introduction
Crude Oil Futures (CL) edged slightly higher on Monday as the market continues to stabilize following last month’s rebound from the $56–$57 support zone. However, after the strong 8.8% recovery from the $56 level seen in late October and our previous analysis, bullish momentum has now started to cool, with prices struggling to break through resistance near the $61–$62 area. This level also coincides with the 50-day moving average, which reinforces the slight control bears have over the bulls.
Crude Oil Technical Analysis
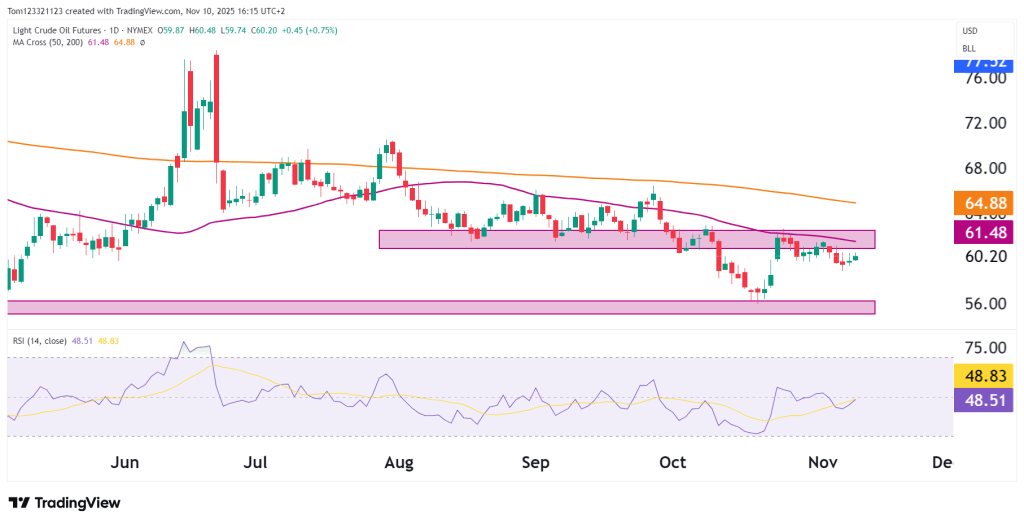
Crude oil remains range-bound between $56 and $64, with the recent bounce from the $56 level being an important one for the bulls. Now, the price is facing resistance at the 50-day moving average ($61.48) and the resistance zone at $62.
There is some short-term strength that is waning as price has struggled to push above the 50 MA, but bulls are looking for a rise in the RSI above 50 to give another chance at a rally.
A close below $59.50–$59.00 could lead to price moving back down to the $56 level.
🎯 Ready to Prove Your Skills?
Start your 7-day free $100K evaluation with OneUp Trader and take the first step toward becoming a funded trader.
Start Evaluation Now →Crude Oil Key Technical Levels
| Type | Level | Description |
|---|---|---|
| Resistance 1 | $61.50 | 50-day MA. |
| Resistance 2 | $64.80 | 200-day MA. |
| Resistance 3 | $68.00 | R2 pivot. |
| Support 1 | $59.00 | Short-term support. |
| Support 2 | $56.50 | Key structural floor. |
| Support 3 | $55.50 | Multi-month base. |
Probability Table (Next 2–3 Weeks)
| Scenario | Estimated Probability | Notes |
|---|---|---|
| Range-bound between $57.50–$61.50 | 50% | Most likely scenario as market consolidates near resistance. |
| Breakout above $61.50 → $64.80–$68.00 | 30% | Requires renewed bullish momentum or strong fundamental trigger. |
| Breakdown below $57.50 → $55.50 | 20% | Possible if macro sentiment weakens or inventories rise. |
Crude Oil Fundamentals
Oil prices have stabilized after October’s selloff, helped by better risk sentiment. Traders are watching OPEC+, with signs the group may keep output cuts into early 2026. Still, demand remains uneven, especially in China and Europe.
A strong U.S. dollar near 99–100 is also capping crude’s upside, and recent EIA data showed a small build in U.S. stockpiles, suggesting supply is still sufficient.
Ongoing Middle East tensions and Fed policy uncertainty are adding volatility. If risk appetite grows or inventories fall, crude could retest the $63–$65 range.
Summary
Crude Oil Futures (CL) are steady above $60 but stuck below resistance at $61.50–$62.00. Despite October’s rebound, momentum has stalled below the 50-day moving average, keeping oil in a neutral range.
A breakout above $62–$63.50 would turn the outlook bullish, while a drop below $59–$57.50 could signal further downside.
For now, oil is range-bound, with traders waiting on key catalysts like OPEC news, U.S. inventory data, or shifts in global risk sentiment to drive the next move.
This analysis is for educational and informational purposes only and does not constitute trading advice or a recommendation to buy or sell any futures contracts. Futures trading involves significant risk and may not be suitable for all investors. Always conduct your own research and consult with a licensed financial professional before making trading decisions.
