


Introduction
The U.S. Dollar Index (DXY) edged up 0.11% to 99.07 on Tuesday, showing signs of steadying after last week’s drop. It’s still holding above key support, with buyers trying to keep momentum going despite mixed U.S. economic data and changing views on Fed policy. Let’s take a closer look at the technicals..
Technical Overview
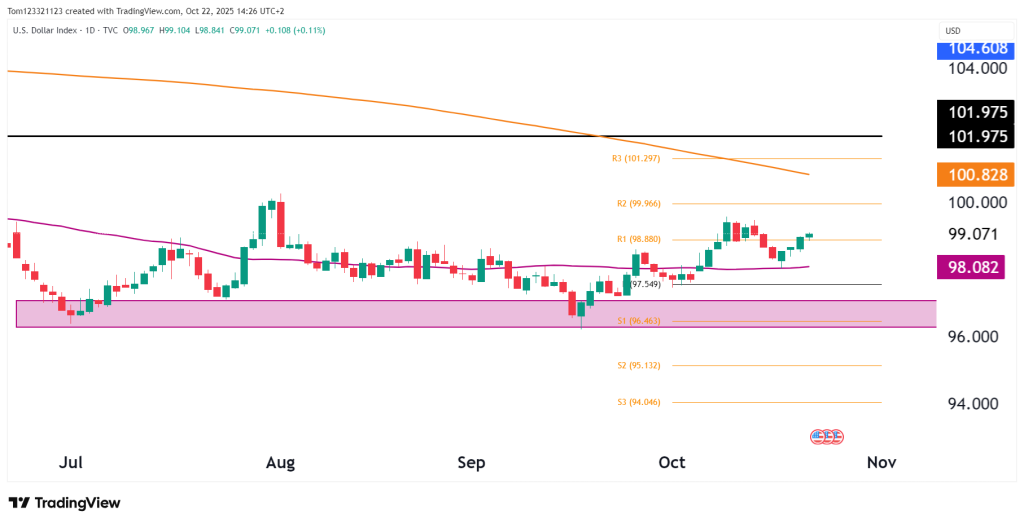
The daily chart shows the U.S. Dollar Index (DXY) holding above the R1 pivot at 98.88 and trading near 99.00. This comes after a bounce from the 97.50–96.40 support zone, which has been a solid base since early summer. The move points to short-term buying interest, but upside is still limited by the 200-day moving average at 100.83 and resistance around 101.00.
The 50-day moving average at 98.08 is now flat, hinting that the downtrend may be shifting into a sideways range. For bulls, a daily close above 100.00–100.20 would confirm a breakout and could lead to a push toward 101.30. If the price gets rejected there, it may drop back to the 98.00–97.50 support area.
Overall, the bigger picture is still neutral to bearish, but the short-term outlook stays bullish as long as DXY holds above 98.00.
Key Technical Levels
| Type | Level | Description |
|---|---|---|
| Resistance 1 | 100.00–100.20 | Psychological resistance / near-term breakout zone |
| Resistance 2 | 101.00–101.30 | 200-day MA / R3 pivot confluence |
| Support 1 | 98.00 | 50-day MA / short-term floor |
| Support 2 | 97.50–96.40 | Key demand zone and S1 support |
| Major Support | 95.10 | S2 pivot / multi-month low |
Probability Table (Next 2–3 Weeks)
| Scenario | Estimated Probability | Notes |
|---|---|---|
| Continuation to 100.20–101.00 | 50% | Short-term bullish momentum is building. |
| Sideways consolidation 98.00–100.00 | 35% | Likely if macro data remains mixed. |
| Breakdown below 97.50 | 15% | Would reassert the broader bearish bias. |
Fundamentals
The dollar is steadying as bond yield swings ease and uncertainty grows around the Fed’s next move. Inflation has cooled slightly, but the job market is still strong, making it unclear if rate cuts will happen sooner than expected.
At the same time, global risk sentiment has improved a bit, reducing some demand for the dollar as a safe haven. Still, with tensions in the Middle East and key U.S. data on the way—like GDP and inflation—volatility could return quickly.
In the short term, the dollar’s direction will also depend on Treasury yields and trends in Europe. A weaker euro, for example, has often helped push the dollar higher.
Summary
The U.S. Dollar Index is holding above key support, showing signs of steadying after recent losses. The 99.00 level is now a key pivot — a move above 100.00 could signal more strength, while a drop below 98.00 might point to another decline.
Right now, the short-term outlook is cautiously bullish, but the long-term trend is still unclear. Traders should watch upcoming U.S. economic data to see if this rebound can last.
This analysis is for educational and informational purposes only and does not constitute trading advice or a recommendation to buy or sell any futures contracts. Futures trading involves significant risk and may not be suitable for all investors. Always conduct your own research and consult with a licensed financial professional before making trading decisions.