Introduction
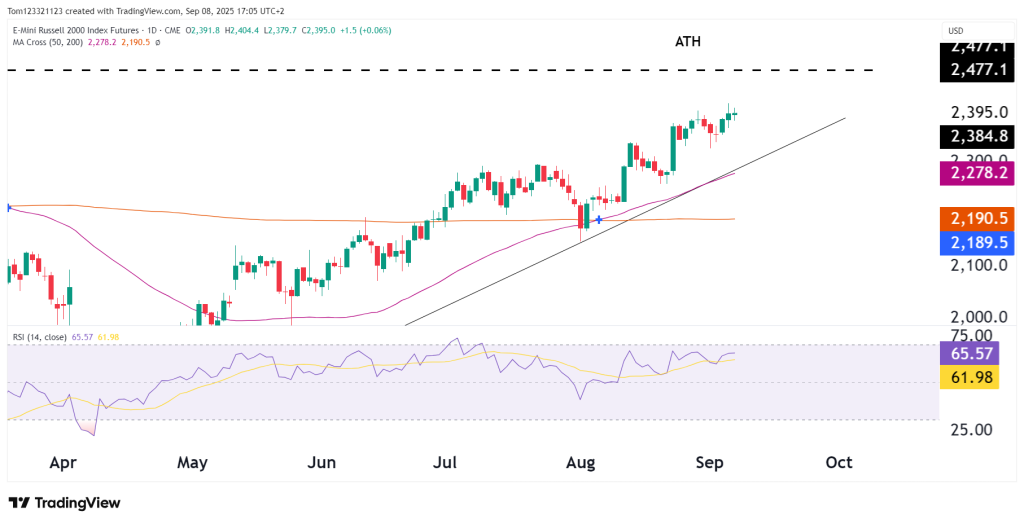
The Russell 2000 (RTY) has been grinding higher along with the other US indices. Small caps now sit just below their all-time high (ATH) at 2,477. Unlike the S&P 500 and Nasdaq, which have dominated the news, the Russell’s recovery has been steadier, but bulls have their eyes set on the all-time high. When small caps rally, it signals that there is a higher risk appetite in the market, and it usually drives everything up.
Technical Analysis
Trend Structure
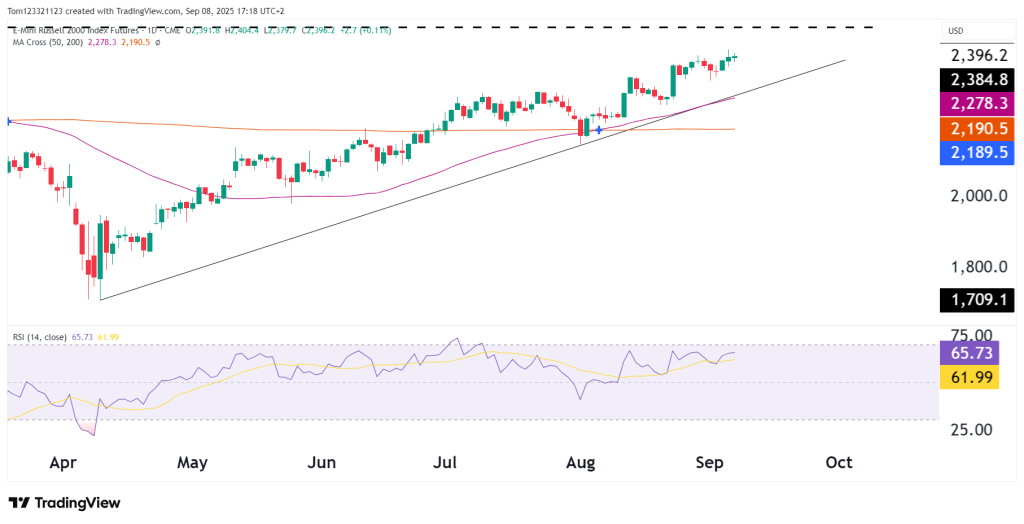
The Russell has been holding above an ascending trendline since April with higher highs and higher lows. The 50MA has also been giving dynamic support as bulls have been buying when the price retraces to the moving average. RTY is now only about 3.5% away from breaking its ATH which would be the first time since November last year.
Key Levels
| Level | Type | Commentary |
|---|---|---|
| 2,477 | ATH Resistance | Major breakout test; sellers may defend |
| 2,384 | Immediate Support | Minor pullback zone |
| 2,278 | 50-day MA | Strong near-term support |
| 2,190 | 200-day MA | Medium-term floor |
| 2,100 | Structural Support | Deeper correction zone |
Probability Table
| Scenario | Estimated Probability | Notes |
|---|---|---|
| Breakout to new ATH (2,500–2,550) | 45% | Momentum is building |
| Range-bound (2,300–2,470) | 35% | Market digests gains before breakout attempt |
| Pullback toward 2,280–2,300 | 20% | Only if risk sentiment sours or rotation fades |
Trade Ideas
Bullish Breakout Play
- Entry: Buy breakout above 2,480
- Target: 2,520–2,550
- Stop: Below 2,430
Pullback Buy Play
- Entry: Long on retracement toward 2,300–2,320
- Target: Retest of 2,470–2,480
- Stop: Below 2,270 (50-day MA)
Final Takeaway
The Russell 2000 is on the verge of a new ATH. While mega-cap indices like the Nasdaq have already pushed very close, RTY’s consolidation and steady climb point toward higher highs.
- A clean move above 2,477 could open the door to fresh highs near 2,550.
- Until then, traders should watch for range-bound action, with the 50-day MA as a critical line of defense.
The risk/reward here favors patient bulls, particularly those looking for rotation into small caps as market breadth improves.