

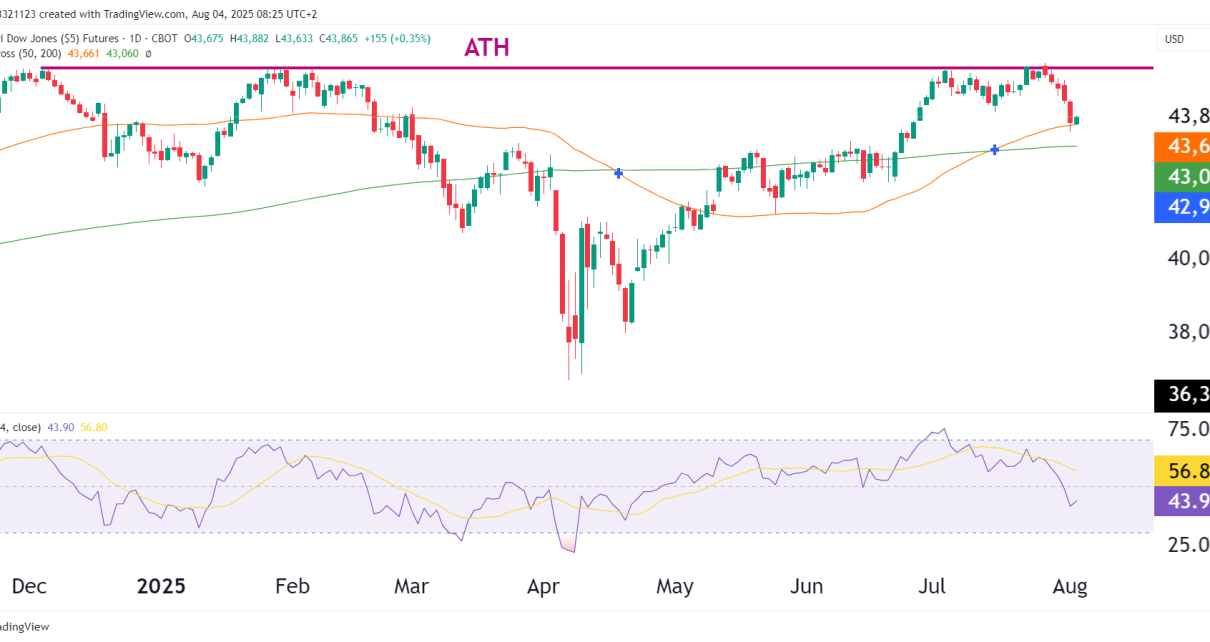
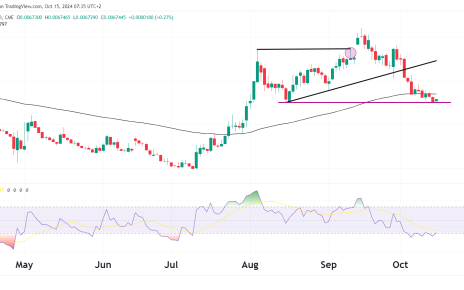
Chart Overview – Daily Timeframe (YM)
Current Price: 43,865
Change: +155 (+0.35%)
50-day MA: 43,661
200-day MA: 43,060
RSI (14): 43.90 — declining momentum
ATH (All-Time High): ~45,280 (not reclaimed)
Technical Analysis
Structure & Momentum:
- Failed breakout attempt above the ATH in late July has led to a small reversal and potential double top, but it is too early to tell.
- Price bounced today off the 50-day MA, now acting as tentative support.
- The 200-day MA sits just below, serving as last-ditch structural support before trend damage occurs.
- RSI plunged from the 60s to under 44.
Risk Zones:
- The zone between 43,050–43,700 (200 & 50 MA cluster) is an important support level, if price breaks below this it would confirm a trend break.
- If price fails to reclaim 44,400 in the coming sessions, sellers may try to break below 43,000 with more force.
Market Context
Relative to Other US Indices:
- NQ (Nasdaq): Still hovering near highs but showing signs of stalling.
- ES (S&P): Holding up better than YM, yet showing small bearish divergence in RSI.
- YM is the weakest of the three right now — failing to maintain new highs and possibly forming a double top.
Macros in Play:
- DXY (Dollar Index) has rebounded, which is typically bearish for equities, particularly industrials.
- Treasury yields have risen, tightening liquidity.
- Recent mixed earnings and Fed commentary have introduced market uncertainty — defensive posture is rising.
Probability Table
| Scenario | Estimated Probability | Commentary |
|---|---|---|
| Reclaim ATH and push above 45,300 | 20% | Unlikely unless momentum returns fast |
| Stabilize in 43,000–44,000 zone | 50% | Most likely in the near term |
| Breakdown below 43,000, trend reversal | 30% | Bears gain full control under 200MA |
Trade Strategy Considerations
Neutral Bias – With Caution
If Bullish:
- Only consider longs on a close above 44,400 with RSI bouncing above 50.
- Target: 45,200–45,300 (retest of highs)
- Stop-loss: Just below 43,000 (lose this = trend break)
If Bearish:
- Consider shorting rallies into 44,000–44,300 zone if rejection occurs.
- First target: 43,000, then possibly 42,500.
Ending Off
The Dollar bounce is leading to a fall in equities, particularly YM. From here, the market will find a new stepping stone and reprice based on this slightly stronger Dollar. The resistance at the previous ATH is going to be the biggest test for the Bulls but overall momentum is still bullish in the long run and this small pullback could be an opportunity to accumulate.