


Recap from Last Update
In our July 10th article, we highlighted the $67–$69 resistance-turned-support zone as the key zone to be focused on. We also noted the looming Iran-Israel geopolitical risks, which created temporary volatility but failed to produce a lasting trend shift.
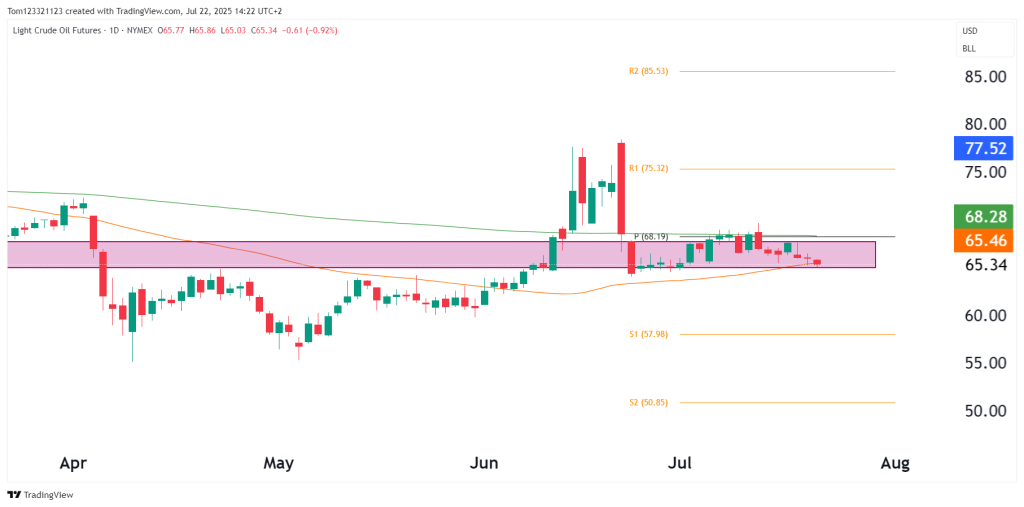
Since then, CL has remained range-bound, and as of today, it’s pressing into the lower edge of the support box, while sitting just below the pivot point (P) at $68.19.
Current Technical Analysis
- Price Range: Oil remains locked in a tight box between $65.30–$68.20.
- 200-day MA (green): Overhead at $68.28, continues to act as dynamic resistance.
- 50-day MA (orange): Flattening near $65.46, aligning with the lower end of the range and providing near-term support.
- Pivot Levels (based on daily chart):
- P = $68.19 – equilibrium level
- R1 = $75.32 / R2 = $85.53
- S1 = $57.98 / S2 = $50.85
- Trend: Flat/neutral bias; momentum remains compressed.
What’s Changed?
- Failed to reclaim 200-day MA despite multiple attempts.
- Price now trades below both 50-day and 200-day moving averages.
- False breakout candle from June has now become a trap zone (above $75), reinforcing range-bound conditions.
Key Technical Levels
| Zone | Level Range | Commentary |
|---|---|---|
| Resistance | $68.20–$69.00 | Pivot level and 200-day MA cluster |
| Support (Critical) | $65.00–$65.50 | Lower edge of the box + 50-day MA |
| Breakdown Level | Less than $64.80 | Would trigger stop runs and open path to $58 |
| Upside Trigger | Greater than $69.20 | Break above pivot range may invite bulls |
Probability Table (Next 1–2 Weeks)
| Scenario | Probability | Conditions / Notes |
|---|---|---|
| Continued range chop ($65–$68) | 50% | Base case; pivot + MAs squeeze price |
| Breakdown to S1 ($58 zone) | 30% | Daily close < $65 with follow-through |
| Breakout toward $75 (R1) | 15% | Requires bullish catalyst and break of $69.20 |
| Breakdown to S2 ($50.85) | 5% | Only on severe macro/geopolitical unwind |
Trade Strategy Outlook
Neutral bias with a bearish lean due to the rejection from the pivot and weakening structure:
- Short-Term Play:
- Sell rallies into $68.20–$69 with stops above $69.40
- Target retest of $64.80–$65.00
- Breakout Setup:
- Long trigger above $69.20, targeting $72–$75, only if accompanied by macro tailwinds or strong risk-on flows.
Conclusion
Crude Oil is sitting at a point where price could make a decisive move either up or down. Anything above $65 is bullish, anything below $64 is bearish.

