

Introduction
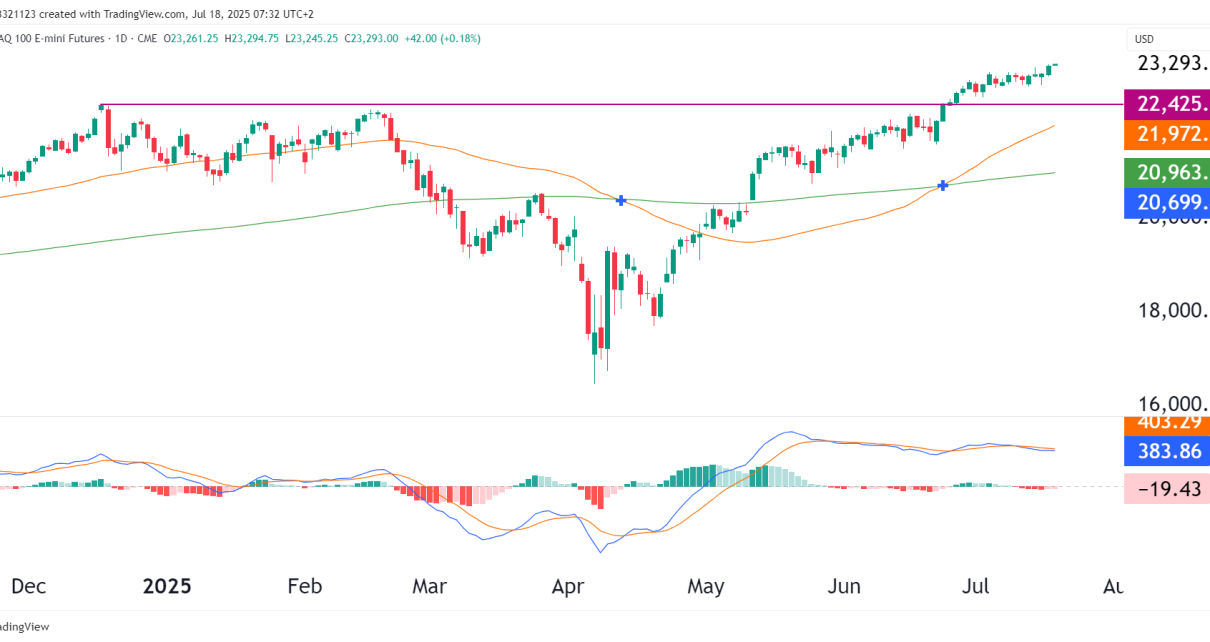
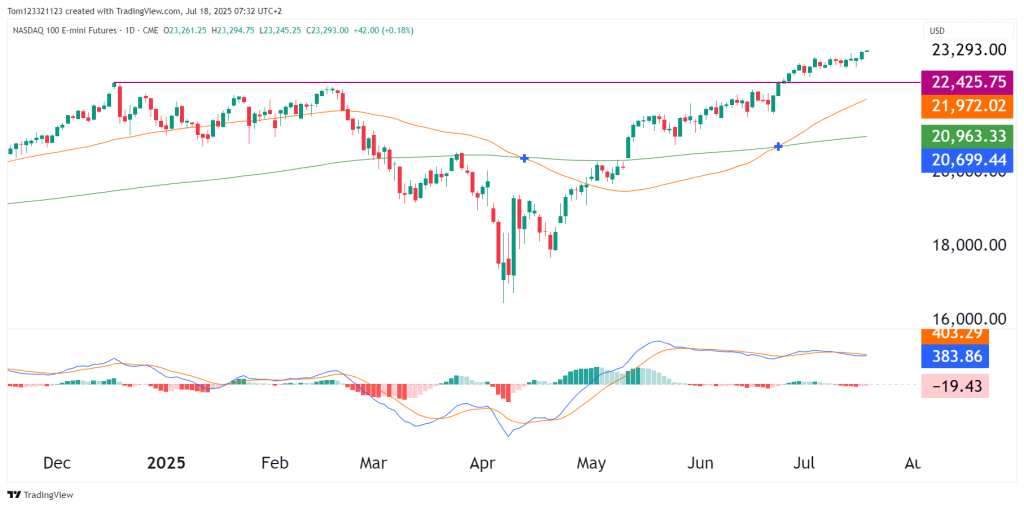
The Nasdaq 100 continues to grind higher, notching fresh all-time highs above the previous ATH at 22,425, confirming the bullish breakout structure discussed in our previous analyses. While price action remains strong, momentum indicators are showing signs of fatigue, which could hint at a short-term breather.
Key Technicals
- Breakout confirmed: The breakout from the 6-month range (capped near 22,425) has followed through convincingly.
- Price above 50 & 200-day MAs: Strong technical positioning above both key MAs (21,972 and 20,963).
- MACD flattening: The MACD histogram has started contracting, and the lines are on the verge of crossing down, so the momentum is slowing slightly.
Probability Table
| Scenario | Estimated Probability | Key Levels | Comments |
|---|---|---|---|
| Continuation higher to 23,800–24,000 | 40% | Above 22,800 | Needs healthy consolidation or renewed volume strength |
| Sideways consolidation | 35% | 22,800–23,300 | Most likely scenario; consolidating gains after breakout |
| Pullback toward 22,425 | 20% | 22,425–22,800 | Acceptable technical pullback into former resistance |
| Breakdown below 22,425 | 5% | Below 22,425 | Would indicate failed breakout and shift market sentiment |
Trade Setup Ideas
- Pullback Longs: Consider scaling into longs if price retests 22,800–22,425, especially if accompanied by MACD reset or rising volume.
- Breakout Re-Entry: If NQ consolidates tightly above 23,200 and volume expands, momentum traders may target 23,800+ on breakout confirmation.
Outlook Summary
- Short-Term: Moderately bullish, but expect chop or mild pullback
- Medium-Term: Bullish, as long as price stays above 22,425
- Long-Term: Very bullish, in confirmed breakout from multi-month range
While the trend remains constructive and price discovery continues, momentum divergence and proximity to all-time highs suggest caution on chasing. Traders should favor buying dips, ideally into the 22,800–22,425 support zone, while monitoring MACD for clues on breakout extension.

