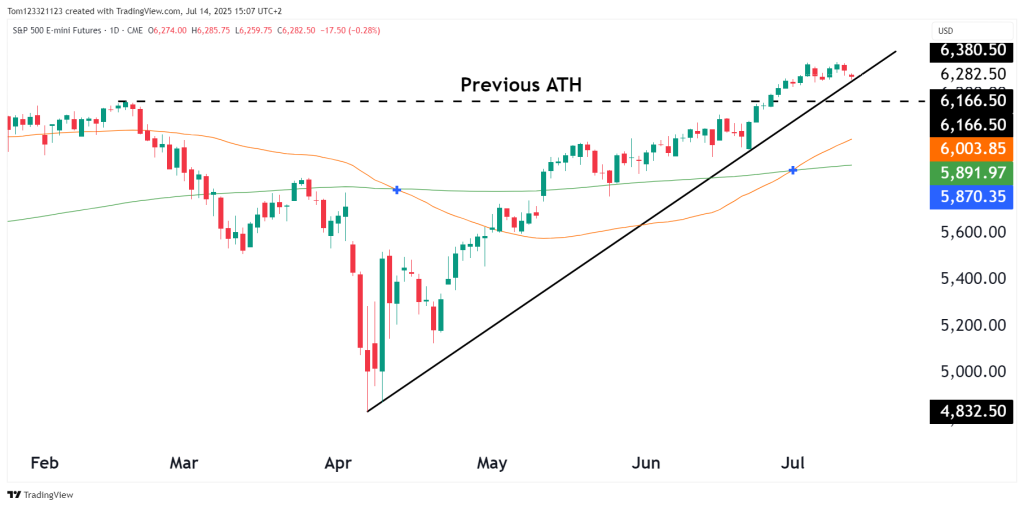
The S&P 500 E-mini futures (ES) remain in a strong uptrend, currently trading at 6,282.50, just shy of the recent all-time high breakout level of 6,380.50. While bulls maintain control, today’s chart shows the index pulling back modestly, hinting at some momentum exhaustion near the highs.
Despite the softness, the price remains well above key support levels and the ascending trendline from April remains intact.
Technical Breakdown
Indicator
Reading
Comment
Price
6,282.50
Slight fade from new highs
Previous ATH
6,166.50
Now acting as new support
200-day MA
5,891.97
Slope turning upward
50-day MA
6,003.85
Tracking trendline support
Trendline Support
~6,220
Dynamic uptrend guide
Support & Resistance Levels
Level Type
Zone / Price Range
Immediate Resistance
6,380–6,400 (recent highs)
Short-Term Support
6,220–6,250 (trendline + minor structure)
Major Support
6,166.50 (previous ATH breakout)
Key Moving Average
6,003–6,005 (50-day MA)
Probabilities Table
Scenario
Probability
Implication
Continued grind higher to 6,400–6,500
55%
Momentum continuation
Retest of 6,220–6,250 (trendline)
30%
Normal pullback in uptrend
Break below 6,166 = failed breakout
15%
Short-term top may be in place
Key Takeaways
Trend remains bullish, but short-term RSI divergence and today’s red candle signal possible slowing.
The 6,166.50 ATH breakout level is now a critical bull-bear line—as long as price holds above it, the bias remains to the upside.
Trade Opportunities
Strategy Type
Description
Trend Buy on Pullback
Entry near 6,220–6,250, stop under 6,166
Breakout Scalping
Buy on clean break above 6,380, target 6,440+
Options Play
Aug 6,200–6,400 call spread for continuation
Timeframe Outlook
Timeframe
Bias
Comment
Short-Term
Cautiously Bullish
Minor cooling, but structure intact
Medium-Term
Bullish
Higher highs and higher lows
Long-Term
Bullish
Above key MAs with macro tailwinds (e.g. dollar weakness)
Ending Off
The S&P 500 futures remain in breakout territory, but with early signs of fatigue. Bulls want to see continued strength above 6,250 and a reclaim of momentum toward 6,400+ for confirmation. Watch the 6,166–6,220 zone closely for clues—this is where short-term control will be decided.
Euro trading below $1 for the first time since 2002 Bearish sentiment remains Potential bounce possible in the shorter term Consolidation zone on the hourly chart Rewind 2 weeks Looking back at the analysis we did on the Euro on August 19th, our call for the break below $1 has been realized. With such a Read More…
Introduction As with most equities this year, YM has seen a resilient surge of 23% since last year’s lows made in October. The ascending triangle pattern on the daily chart has been the primary focal point for our technical analysis as we try to find favorable risk-reward ratios and high-probability trades. Let’s take a fresh Read More…
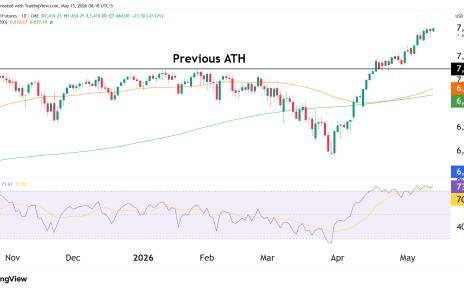
Introduction The S&P 500 continues to push higher after reclaiming the previous all-time high near 7,100, and the strength of this rally is becoming difficult to ignore. The narrative of being careful because of the developments in the Middle East is starting to fade because the market is just moving up relentlessly. What started as Read More…