

Introduction
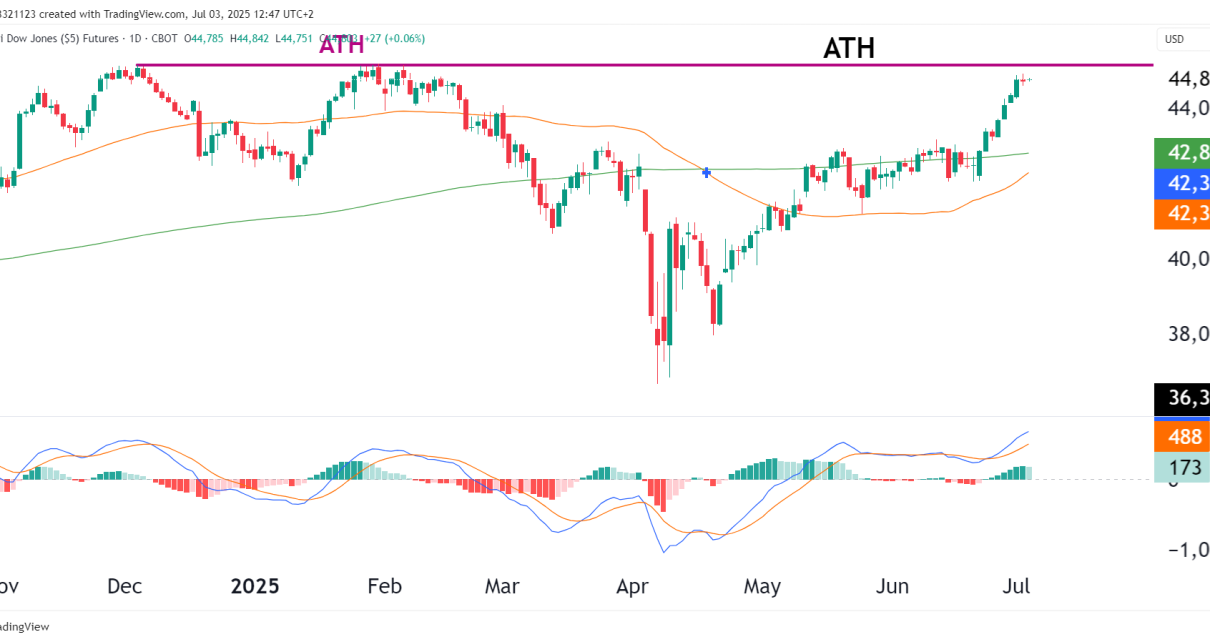
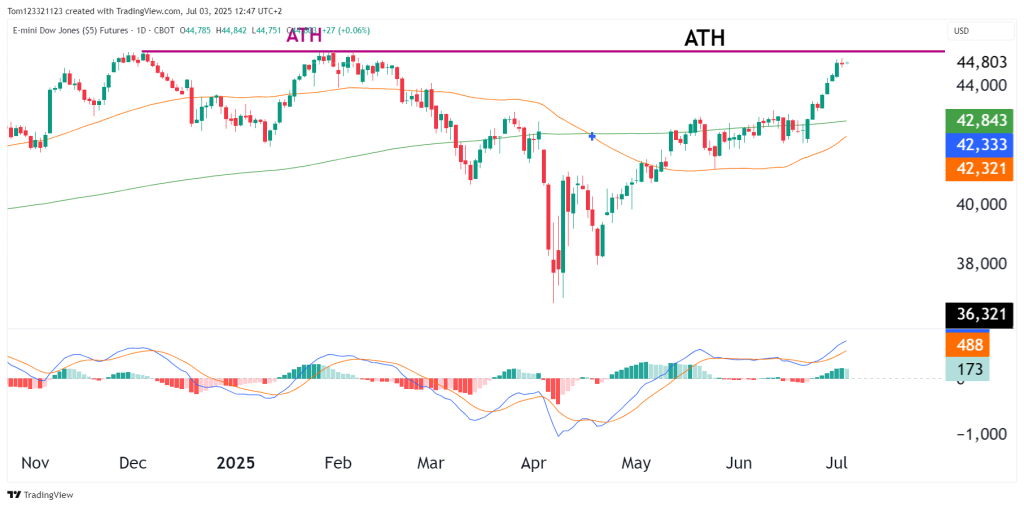
The Dow is knocking on the door of all-time highs, trading just beneath the ~44,800 resistance zone. With mega-cap indices (like NQ and ES) already in breakout, YM’s late surge confirms a broader market rally, and a potential rotation into industrials and value-heavy components. The weak Dollar is undoubtedly contributing to this.
Technical Overview
| Metric | Value / Signal |
|---|---|
| Last Price | 44,803.0 |
| Previous ATH | ~44,800 (now being retested) |
| 200-day MA | 42,843 (price well above = strong uptrend) |
| 50-day MA | 42,321 (also rising, golden cross confirmed) |
| MACD | Bullish momentum accelerating |
| Trend | Strong and steep since late May |
Price is parabolic and overextended in the short term, but very little overhead resistance remains. If bulls follow through above ATH — there’s no technical ceiling.
Probability Table
| Scenario | Probability | Commentary |
|---|---|---|
| Breakout above ATH and trend continuation | 55% | Strong momentum, no resistance overhead |
| Pullback to 43,800–44,200 support | 30% | Overbought short-term; possible retest of recent breakout base |
| Sharp rejection below 44,000 | 15% | Unlikely without external catalyst or rate surprise |
Trade Setups
| Strategy | Setup |
|---|---|
| Breakout Buy | Long above 44,850 with tight stop at 44,300; target near 46,000 |
| Retest Entry | Buy pullback to 44,000–44,200; stop below 43,600 |
| Options Play | Short-dated bull call spread above 45,000 for limited risk |
Note: If YM clears the ATH cleanly, momentum chasers may fuel an acceleration move toward the psychological 46,000–47,000 zone quickly.
Final Outlook
Short-term: Bullish, testing key resistance
Medium-term: Bullish bias, especially on weekly close above ATH
Long-term: Breakout sets stage for Dow leadership into Q3
