


Introduction
Light Crude Oil Futures (CL) are trading sharply higher at $73.51, up more than 20% from the May lows. The breakout is technically significant, but more importantly, it’s now being supported by growing geopolitical risk in the Middle East due to renewed conflict escalation between Iran and Israel, which has once again injected a risk premium into global energy markets.
Recent headlines confirm:
- Israeli airstrikes targeted Iranian proxies in Syria and Lebanon over the past week. In response, Iran has issued direct threats and is reportedly repositioning missile systems closer to the Strait of Hormuz.
- Analysts warn of potential disruptions to oil shipments through the Hormuz chokepoint, which accounts for roughly 20% of global oil trade.
- U.S. and European officials have called for de-escalation, but energy traders are pricing in a conflict premium, fearing potential retaliation or tanker attacks similar to 2019–2020 events.
The market is now factoring in the possibility that geopolitical volatility — not just fundamentals — will drive the next leg in oil pricing.
Technical Outlook (Daily Chart)
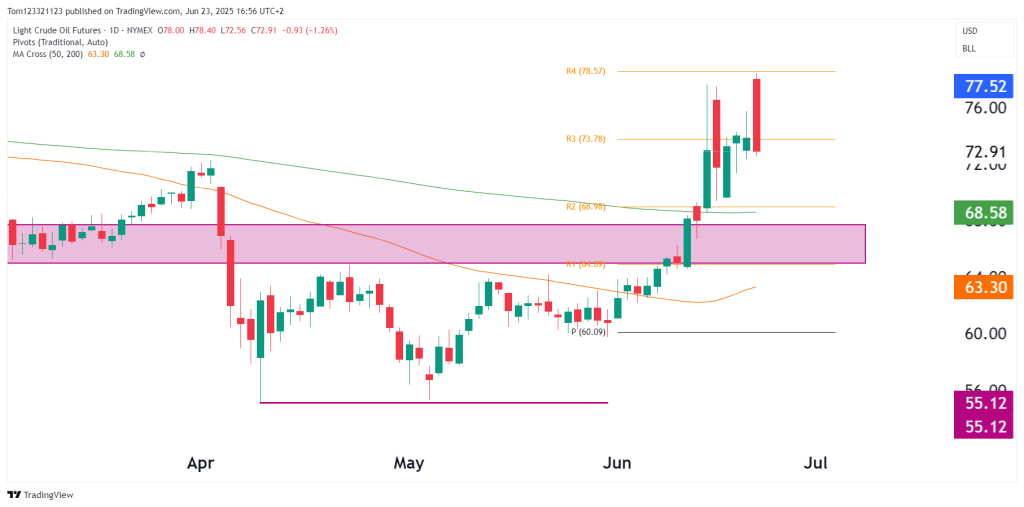
- Breakout above multi-month resistance zone ($68–69) was explosive. The price cleared the 200-day MA ($68.57) with strong momentum and volume.
- RSI has surged to 78.81, entering overbought territory — a level often associated with short-term pullbacks, but also typical of momentum-driven breakouts.
- Price is well above both the 50-day MA ($62.36) and 200-day MA — now acting as clear support zones.
- Nearest resistance lies around $77.50–$78.50 (R4) — the upper end of current pivot structure.
Key Technical Levels
- Support:
- $68.50–69.00 → former resistance, now critical support
- $66.00 → minor horizontal support
- $62.36 (50-day MA) → structural bull support
- Resistance:
- $77.50–78.50 → psychological and technical target (R4)
- Above this, minimal structure until $80.00
Market Scenarios & Probabilities Table
| Scenario | Description | Probability | Implication |
|---|---|---|---|
| Bull Continuation to $78.50+ | Geopolitical risk premium persists; crude holds above $68–69 and targets R4 ($78.50) or higher | 50% +/- | Breakout continuation; momentum traders stay long |
| Pullback to Retest $68.50–69.00 (Breakout Zone) | Market digests gains; overbought RSI triggers mean reversion; conflict doesn’t escalate further | 35% +/- | Long entry on dip with tight stops below $66 |
| False Breakout – Drop below $68 | Geopolitical tension cools or surprise macro data weakens demand outlook | 15% +/- | Short setup opens if $68 fails; possible move to $66 |
Trade Opportunities & Setups
| Setup Type | Entry Zone | Stop-Loss | Target | Commentary |
|---|---|---|---|---|
| Momentum Long | On close above $74.50 | Below $71.50 | $77.50 – $78.50 | Breakout continuation with tight risk/reward; RSI extended — scale position |
| Buy-the-Dip | $68.50–69.00 support retest | Below $66.00 | $74.00 then $78.00 | Favorable R:R; look for bullish reversal candle or doji in the zone |
| Fade Trade (High Risk) | $77.50–78.50 resistance zone | Above $79.50 | $72.00 | Short against R4 with small size; high risk due to news-driven nature of rally |