


Chart Structure
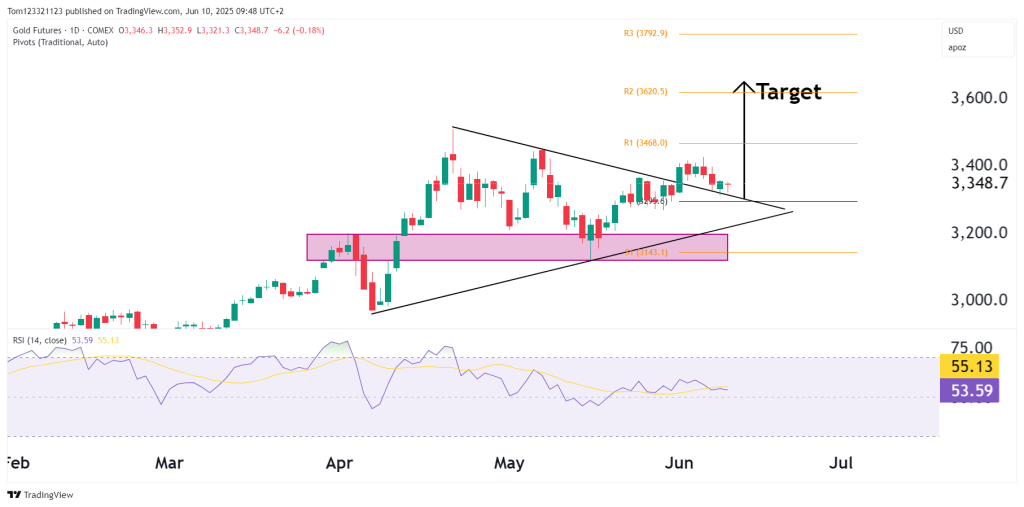
Symmetrical Triangle
- The triangle started from late April with a measured move target to ~$3,620 (R2).
Previous Demand Zone
- Price has respected the pink supply area around $3,145–$3,200, now forming a solid base structure.
- Buyers consistently emerged there on downside tests, reinforcing the breakout case.
Indicators
RSI (14)
- 53.59, neutral but rising modestly.
- Slight bullish divergence vs. late-May price low; indicates fading downside momentum.
- Needs >60 to confirm bullish momentum breakout.
Pivot Levels
| Level | Description |
|---|---|
| S1 $3,143 | Key support/demand base |
| Pivot $3,246 | Inside triangle, base for breakout |
| R1 $3,468 | Initial resistance on breakout |
| R2 $3,620 | Primary measured target |
| R3 $3,792 | Stretch target if breakout is impulsive |
Market Context
- Real yields have ticked lower and DXY has weakened — both historically bullish for gold.
- No technical signs of distribution at highs; instead, tight range + shallow pullbacks favor bullish continuation.
- Macro backdrop (soft-landing, global rate cuts) supports the bid in real assets.
Trades
Bullish Breakout Entry
- Trigger: Daily close above $3,355–$3,360 (clear breakout from triangle top).
- Target 1: $3,468 (R1)
- Target 2: $3,620 (R2, triangle measured move)
- Stop: Below triangle support or $3,240 (last higher low).
- Probability: High — breakout setups from triangles after major impulse moves historically carry strong trend continuation odds.
Failure Reversal Watch
- If price fails to hold triangle base near $3,240, a deeper retracement to $3,145–$3,200 support is likely.
- RSI <50 and a breakdown would invalidate near-term long setups.
Bear/Bull Case Summary
| Case | Arguments |
|---|---|
| 🐂 Bull | Breakout triangle setup, rising base, strong support at $3,145, macro tailwinds |
| 🐻 Bear | Triangle fakeout risk if momentum stalls + RSI rolls under 50 |
Conclusion & Outlook
Gold continues to coil within a textbook continuation pattern just below recent highs. The structure favors a bullish continuation, with a measured move target of $3,620. Momentum confirmation via RSI >60 and breakout candle close will be key.
Bias: Bullish breakout pending
Short-term Target: $3,468
Medium-term Target: $3,620+
Invalidation: Break and daily close below $3,240

