Technical Analysis
Structure and Trend
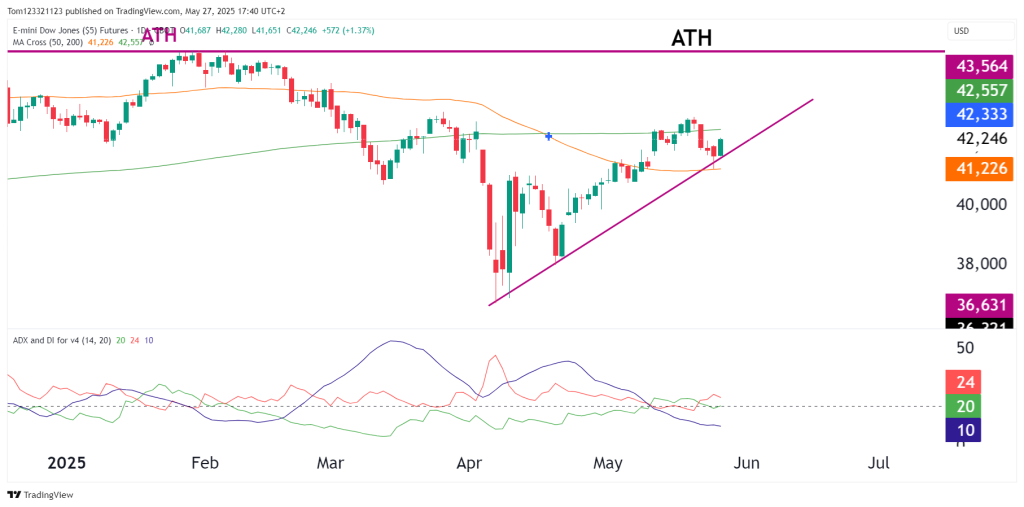
- Uptrend Support Line: YM is respecting an ascending trendline from the April lows on the daily chart.
- Friday’s pullback found support right on this trendline, leading to yesterday’s bullish bounce.
- The price is now sandwiched between the 50-day MA (support) and 200-day MA (resistance).
Any clean break above the 200-day MA opens room toward the all-time high (~43,564).
A bullish “golden cross” is not yet active, but a sustained breakout could tilt momentum in that direction.
Probabilities
| Scenario | Description | Probability | Targets |
|---|---|---|---|
| Bullish Continuation | Holds trendline and breaks above 200-MA | High | 42,557 → 43,564 (ATH retest) |
| Neutral Range | Choppy action between MAs with no trend confirmation | Low | 41,226–42,333 sideways |
| Bearish Breakdown | Break below trendline and 50-MA | Low | 40,500 → 39,800 (early May lows) |
Key Levels to Watch
| Type | Price | Significance |
|---|---|---|
| Resistance | 42,333 | 200-day MA (Key supply barrier) |
| Resistance | 42,989 | Swing high – May 20 |
| Resistance | 43,564 | All-Time High |
| Support | 41,226 | 50-day MA and trendline confluence |
| Support | 40,000 | Psychological round number |
| Support | 39,800 | April breakout retest zone |
Summary
- YM remains bullish on the technicals as long as the upward sloping trend line and the 50 SMA holds.
- Bulls need to push above the 200-day moving average and 42,557 swing high to unlock momentum toward ATHs.