

Is the rally losing steam at the mid-range? Bearish pressure mounting below resistance.
Technical analysis
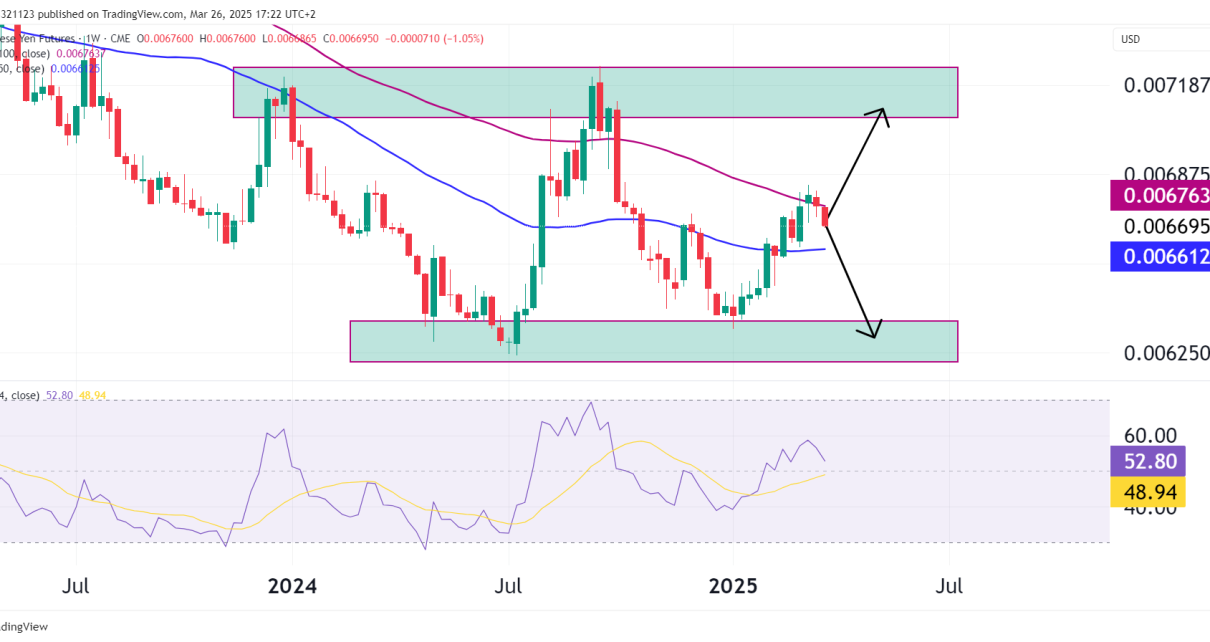
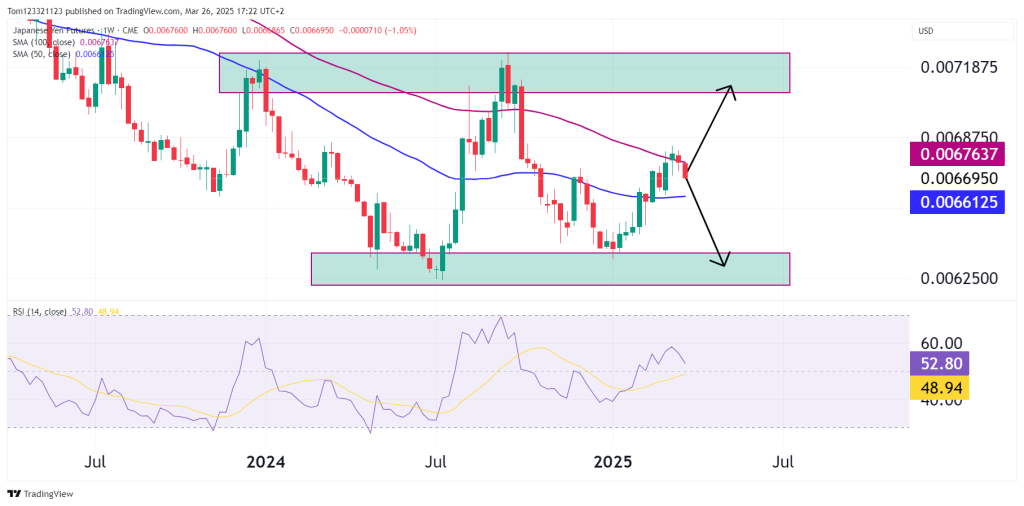
The Japanese Yen futures remain locked in a well-defined range between 0.00718 (resistance) and 0.00625 (support). Price has rebounded strongly off support in early 2025, but it’s now in a point where either the bulls will show what they can do, or it is likely to move back down into the support zone.
We are trading just below the 100-week SMA (0.00676) and the 50-week SMA (0.00661) and price has come back to test these now— both of which have acted as bearish barriers throughout the downtrend that began in early 2022.
Technical Signals
Bias: Slightly Bearish
While the recent rally from the lower range support was strong, the momentum is beginning to fade into a cluster of resistance. This favors at least a short-term pullback, if not a full retest of support.
Key Resistance
- 0.00676–0.00718: Supply zone with multiple weekly rejections and alignment with the 100 SMA.
- Long upper wicks on recent weekly candles show selling pressure on every approach to the top end.
Key Support
- 0.00625–0.00630: Range bottom and major demand zone. Price has reliably bounced here for over a year.
- If price breaks below the 50-week SMA again, it opens the door to another test of this zone.
Primary Trade Setup – Short Bias
With price stalling beneath the 100-week SMA and multi-month resistance zone (0.00676–0.00718), short setups offer the highest probability trade at this level.
Short from Resistance Zone
- Entry Zone:
0.00695 – 0.00705 (ideally into a wick or candle rejection) - Stop-Loss:
Above 0.00720 (just beyond the upper bound of resistance and above recent wick highs) - Take-Profit Targets:
- TP1: 0.00660 (mid-range level + 50 SMA)
- TP2: 0.00635
- TP3: 0.00625 (major support)
- Risk/Reward:
~1:2.5 or better (depending on entry precision) - Confirmation to Wait For:
- Rejection candle (shooting star / bearish engulfing on daily/weekly)
- RSI begins to roll over from the 50–55 zone
- Volume spike or long upper wick
Alternative Trade – Range Bounce Buy (only if price drops first)
If price returns to the support zone around 0.00625 and forms a clear bullish reversal pattern, a bounce trade back toward the mid-range may be viable.
- Entry: 0.00628 – 0.00632
- Stop: 0.00618
- TP1: 0.00650
- TP2: 0.00665
- TP3: 0.00675 (50 & 100 SMA crossover zone)
Probability on this setup is lower unless macro environment shifts positively (e.g., risk-off environment or dovish Fed).
Neutral / No Trade Zones
Avoid entering:
- Inside the middle of the range (0.00660–0.00675)
→ Choppy area, too close to mean reversion - Without confirmation — especially if momentum is unclear