Introduction
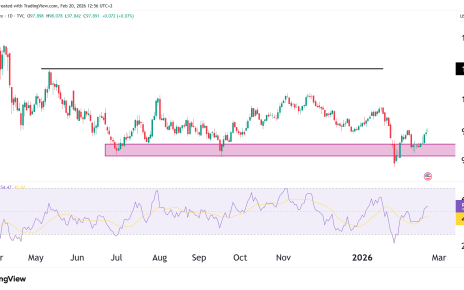
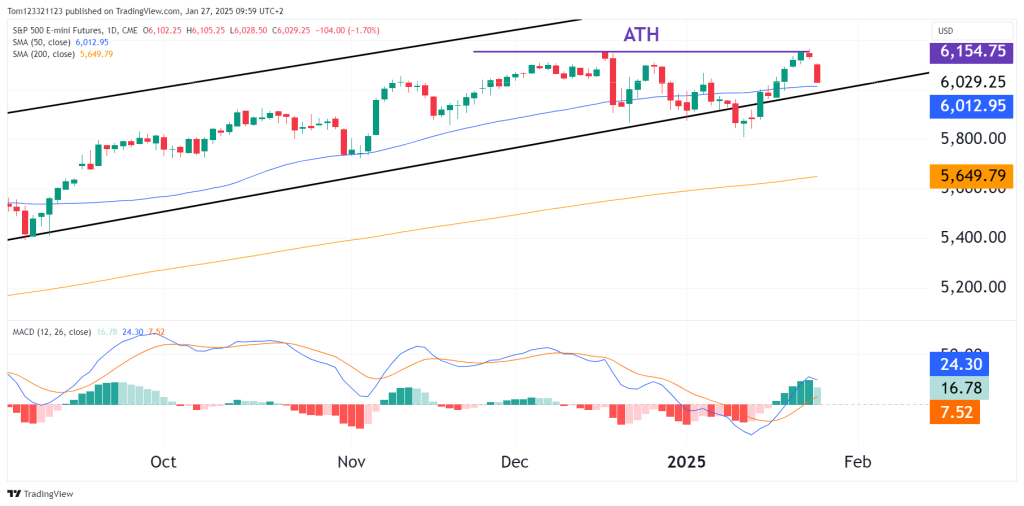
In our previous analysis on January 16, 2025, we identified the potential for ES to continue its rally within the bullish channel with the all-time high (ATH) at 6,154.75 as the next target. Price recently tested this level but failed to break through, forming a double top pattern on the daily chart.
Today has started with a sell-off, lets see why.
Market drivers behind the sell-off
Hawkish Fed:
- Federal Reserve officials have reiterated their stance on keeping interest rates elevated for an extended period to combat inflation, causing investors to reassess growth prospects.
- This has led to concerns about higher borrowing costs and a potential slowdown in corporate earnings growth.
Profit-Taking Near ATH Levels:
- Investors appear to be taking profits after the strong rally in January, with price stalling at resistance.
- The failure to break above the ATH has reinforced short-term selling pressure.
Trump Administration Policies Taking Effect:
- President Trump’s new economic policies, including corporate tax cuts and trade renegotiations, have begun to take effect.
- Concerns surrounding potential trade tensions and their impact on global supply chains have contributed to the cautious market tone.
- Deregulation efforts in the energy and financial sectors have been well received, but investors are awaiting further clarity on fiscal spending initiatives.
Global Economic Concerns:
- Weak economic data out of Europe and China has added to global growth concerns, contributing to the broader risk-off sentiment in today’s sessions.
Technical analysis
Double Top Formation
- A clear double top has formed at the 6,154.75 ATH.
- Confirmation of the pattern would require a break below key support at 5,811.95 (50-day SMA), which could trigger further downside toward lower support levels.
Support and Resistance Levels
Resistance Levels (Upside Targets):
- 6,154.75 (ATH) – The key resistance level; a breakout above this level would invalidate the double top and open the door for further upside.
- 6,200 – 6,250 – Potential extended upside target if bulls regain control.
Support Levels (Downside Risk Zones):
- 6,012.95 (50-day SMA) – Immediate support level; a breakdown could accelerate selling pressure.
- 5,900 (Channel Support) – The lower trendline of the bullish channel; a critical area to watch.
- 5,649.79 (200-day SMA) – Long-term support; a break below this level would signal a structural shift in trend.
Scenarios to watch
Bullish Case (Continuation Higher):
- A bounce off the 6,012.95 support level could lead to another retest of the 6,154.75 ATH.
- A breakout above the ATH would invalidate the double top pattern and open the path to 6,200 – 6,250 in the short term.
Bearish Case (Breakdown from Key Levels):
- A confirmed break below the 50-day SMA at 6,012.95 would likely lead to a test of channel support near 5,900, followed by the 200-day SMA at 5,649.79.
- Failure to hold these levels could result in a broader correction.
Possible trade setups
Bullish Setup:
- Entry: Long positions on a successful retest and hold above 6,012.95 (50-day SMA).
- Targets:
- First target: 6,100.
- Second target: 6,154.75 (ATH).
- Stop-Loss: Below 5,990 to limit downside risk.
Bearish Setup:
- Entry: Short positions on rejection from the ATH (6,154.75) or breakdown below 6,012.95.
- Targets:
- First target: 5,900 (channel support).
- Second target: 5,650 (200-day SMA).
- Stop-Loss: Above 6,100 to manage risk.