Equities fell on Monday as tensions in the Middle East worsened after the US announced it would reinstate its blockade on Iranian shipping. As a result, oil prices jumped, and expectations of a Fed rate hike increased. At the same time, market participants are looking forward to the US CPI report coming out later in Read More…
Month: July 2026
Nasdaq 100 Futures (NQ) Technical Analysis – 14 July 2026
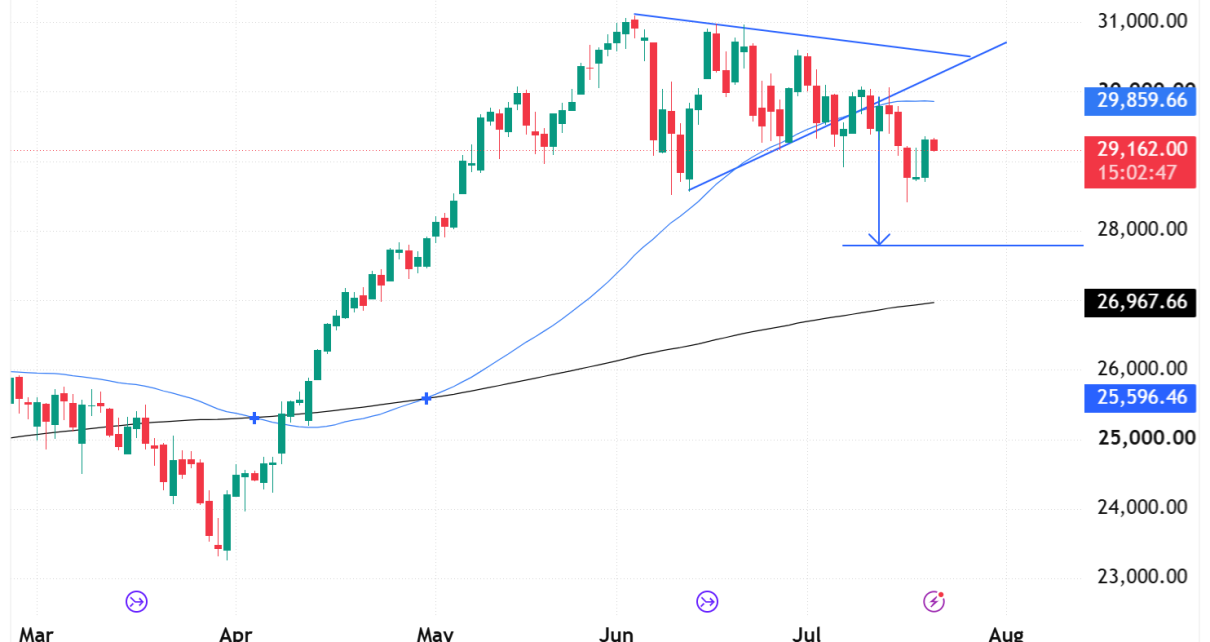
Introduction NQ closed at red to start the week off, below its 50-day moving average (29,801.12) for the first time since this leg of the rally began. Price also dipped as low as 29,303.25 intraday, testing the rising trendline off the recent triangle before bouncing back. Combined with a bearish MACD reading, this is the Read More…
Nikkei Futures Technical Analysis – 13 July 2026
Introduction Nikkei futures printed a sharp reversal day today on Monday the 13th of July, opening at 69,070, pushing up to 69,225, then selling off hard to close at 67,355 near the session low. That’s a wide-range bearish candle after a strong multi-month uptrend, and it’s testing the 50-day moving average at the moment. Looking Read More…
Dollar Strength Keeps Currency Futures Under Pressure
Currency futures were subdued on Monday as the dollar rebounded amid an increase in Fed rate hike expectations. Tensions in the Middle East escalated further over the weekend, leading to the closure of the Strait of Hormuz. As a result, oil prices jumped, fueling inflation worries. Meanwhile, market participants are cautiously awaiting the US CPI Read More…
How to Draw & Trade Trend Lines (Beginner – Advanced Guide)
Featured Snippet: What Are Trend Lines in Trading? Trend lines are lines drawn on a price chart to show the direction of a market. They connect key highs or lows and act as support or resistance levels. Traders use trend lines to identify trends, spot entry points, and anticipate potential reversals or breakouts. More importantly, Read More…
S&P 500 Futures (ES) Technical Analysis – 10 July 2026
Introduction S&P 500 futures are retesting the underside of their June swing high after reclaiming the 50-day moving average on the pullback. Price is currently at 7,581.25, just below the 7,650 area that capped the rally in early June. It is an important zone now, there are some flags forming on lower time frames, so Read More…
Interest Futures Rebound on Hopes of US-Iran De-Escalation
Interest futures recovered on Friday as market participants hoped for a de-escalation of tensions between the US and Iran. At the start of the week, the countries exchanged fire, causing panic and concerns about a full-blown war. At the same time, Trump said the ceasefire deal with Iran was over. Uncertainty hit markets last week Read More…
Nasdaq 100 Futures (NQ) Technical Analysis – 9 July 2026
Introduction Nasdaq 100 futures are still consolidating below their June highs, but the structure on the daily chart is starting to take shape. Price closed at 29,718.75, holding just above the rising 50-day moving average after bouncing off a fresh swing low earlier this week. The bigger question is whether this is basing for another Read More…
Oil Prices Rise on Renewed Middle East Tensions
Oil prices jumped on Wednesday amid escalating tensions between the US and Iran. The US bombed Iran a day after two tankers were hit near the Strait of Hormuz. Market participants were concerned about supply disruptions after Iran warned it would close the Strait again. Meanwhile, FOMC minutes revealed a split among policymakers over the Read More…
Gold Price Today: Key Support Test on GC Futures
Introduction Gold futures have spent the past five months unwinding a powerful rally that took the metal from roughly 2,900 in December to an all-time high near 5,414 in February. Since that peak, bears have carved out a persistent downtrend, and gold is now trading at 4,458.5 — testing a zone where a long-term support Read More…