

Technical analysis RSI: The rsi is the indicator showing bearish divergence in the daily chart. Looking at the chart below, the divergence is strong, and this tells us that we shouldn’t consider taking long positions. Squeeze: The price action has been squeezing toward the top of the recent move. This indicates less buying pressure is present, and Read More…
Month: May 2023
Equities Mixed as US Inflation Report Looms
The US equities rally paused on Monday as investors shifted their focus to a key inflation reading later in the week. Throughout the day, stocks struggled for direction due to disappointing earnings from Tyson Foods and Catalent and a short-lived rebound in regional banks. Catalent Inc’s shares tumbled as the contract drug manufacturer reported lower Read More…
Currency Futures Mixed as Dollar Surges on Jobs Gain
Currency futures ended Friday mixed as the dollar rose after an upbeat jobs report. The dollar lost some of its gains made earlier versus the Euro but maintained its strength against the yen. April’s employment gains and wage growth exceeded economists’ expectations but revealed negative job revisions for March. The employment figures rose by 253,000, Read More…
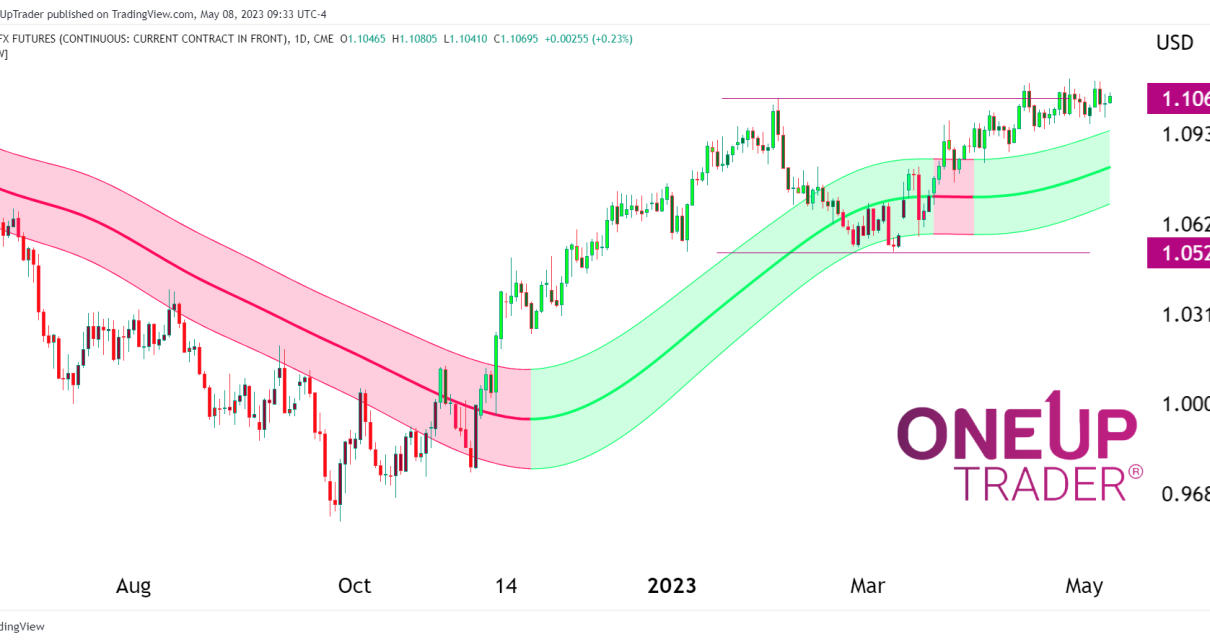
Euro FX futures (6E) stall as resistance band forms
Technical analysis MACD: The MACD is in the red on the daily chart showing some divergence. The buying pressure is weakening and is being translated for us easily in the MACD histogram. Price: The Euro has begun to for a rolling over pattern as it struggles to break above 1.106. We can see from the chart that Read More…
Gold Surges as Investors Scramble for Safety Amid Renewed Banking Fears
On Thursday, gold continued its remarkable surge, supported by predictions for a pause in US rate hikes as US banking fears intensified a flight to the safe-haven metal. Wall Street dropped due to PacWest’s decision to look into strategic options. The news increased worries about the health of local banks and countered the optimism about Read More…
Huge spinning top has bulls singing in CL futures
Technical analysis CL remains within the range we have been monitoring in almost every article this year made on crude futures. This range refuses to be broken in either direction. We can keep the technical analysis very simple with this trade as a huge spinning top has formed at the bottom of a 3-week sell-off. Read More…

Oil Drops 5% on Economic Growth Concerns Fueled by Rate Hikes.
Oil prices fell 4% on Wednesday after the US Federal Reserve increased interest rates and as investors worried about the economy. Oil fell by 5% in the previous session, experiencing its largest daily percentage fall since early January. The Fed lifted interest rates by a quarter of a percentage point on Wednesday afternoon. This rate Read More…
Dangerous inverted hammer strikes fear into the Gold futures bulls
Technical recap Gold has been in an uptrend for 2023 and is up nearly 30% since the November 2022 low. There is something that has put some fear into bulls for the time being, though, and it is a big inverted hammer on the daily chart. Inverted hammer This particular candlestick is extra powerful because Read More…
Equities Post Losses Amid Uncertain Banking Sector, US Govt Debt Crisis
US equities ended lower Tuesday due to concerns that the government would run out of money after June 1 without a debt ceiling increase. Bank stocks collapsed following the weekend failure of American regional bank First Republic Bank. Energy shares tumbled as oil prices fell by 5% to a five-week low amid Concerns about the Read More…
Equities Edge Lower After Data as Investors Await the Fed Meeting
Wall Street equities ended slightly down, and Treasury yields rose as investors reviewed Monday’s data. They were awaiting Wednesday’s Fed’s interest rate decision and quarterly earnings reports. Data showed that the US manufacturing sector recovered from a three-year low in April as new orders and employment increased. However, the sector’s activity remained weak due to Read More…