


Introduction
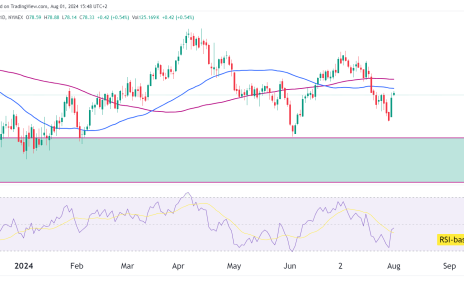
Bulls continue to dominate the price action for Gold futures as the yellow metal has made another all-time high. The RSI has been overbought for almost a month and price is clearly above both the 50 and the 200 moving average. Lets take a closer look at the technicals and see what they say.
Technical Update

Trend
Gold remains in a strong uptrend and has been since October 2022. On the daily chart, there are higher highs and higher lows since the breakout above the $3,600 support box. The 50-day MA at $3,500 is steadily rising and price is well above it.
The breakout zone at $3,600–3,620 is now an important support area. If retested, bulls will want to see it defended to maintain trend strength.
RSI sits at 75.12, very overbought. Buying pressure might be overextended at this point.
Key Levels
| Level | Type | Note |
|---|---|---|
| 3,850–3,875 | Resistance | Next upside target if momentum continues |
| 3,800 | Resistance/Minor Support | Current test area |
| 3,600–3,620 | Major Support | Prior breakout zone |
| 3,500 | Support | Rising 50-day MA |
Outlook
- Bull Case:
As long as GC holds above $3,600, the uptrend remains solid. A breakout above $3,850–3,875 could lead to a move toward $3,900+. - Bear Case:
Overbought RSI increases the chances of a pullback. A rejection at $3,800 could lead to a retest of $3,600–3,620, with deeper support at the 50-day MA near $3,500.
Ending Off
Gold’s trend remains decisively bullish, but might be overdone in the short term. A pullback into the $3,600 zone would be healthy and could provide new long entries, while a push above $3,850 opens the door for new all-time highs again.
