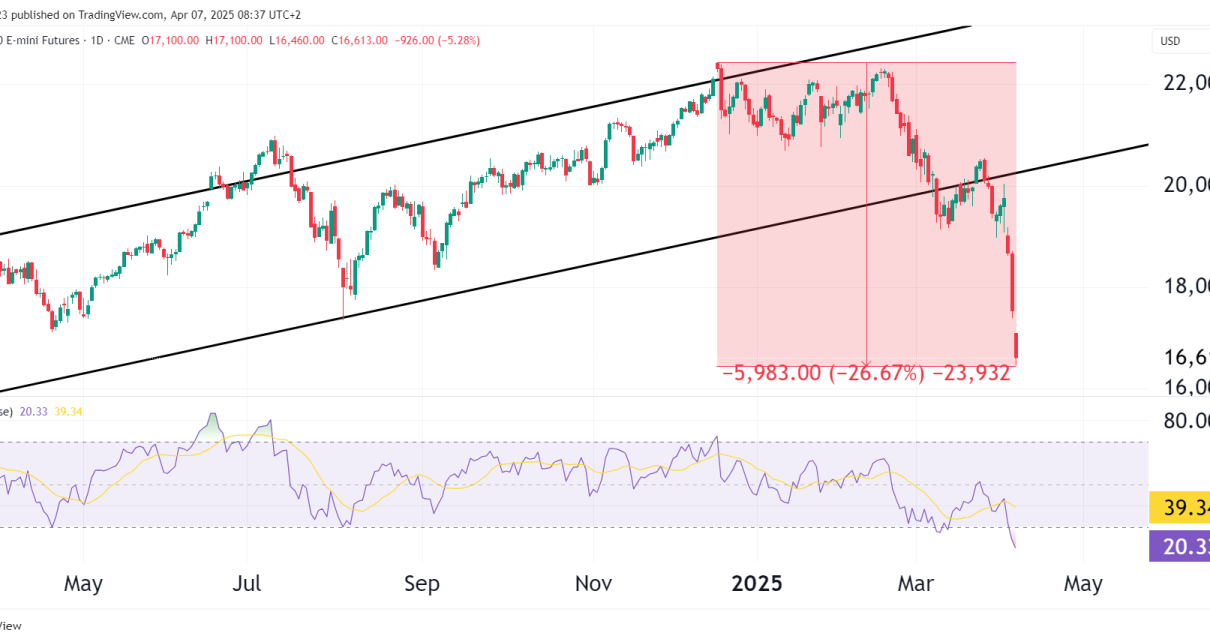
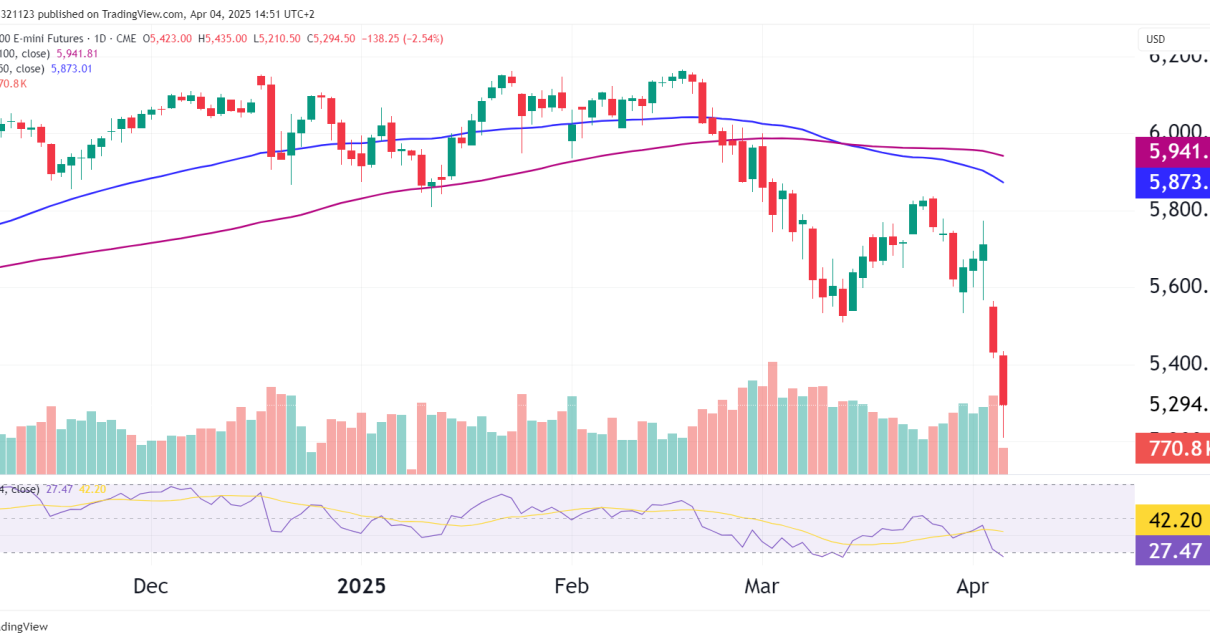
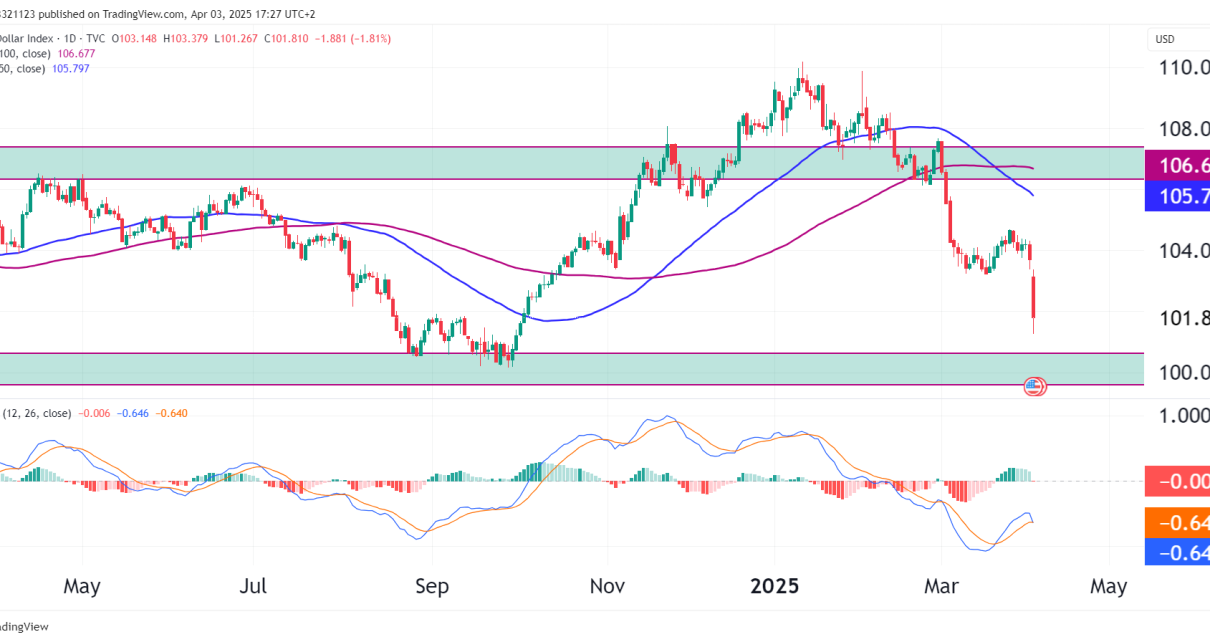
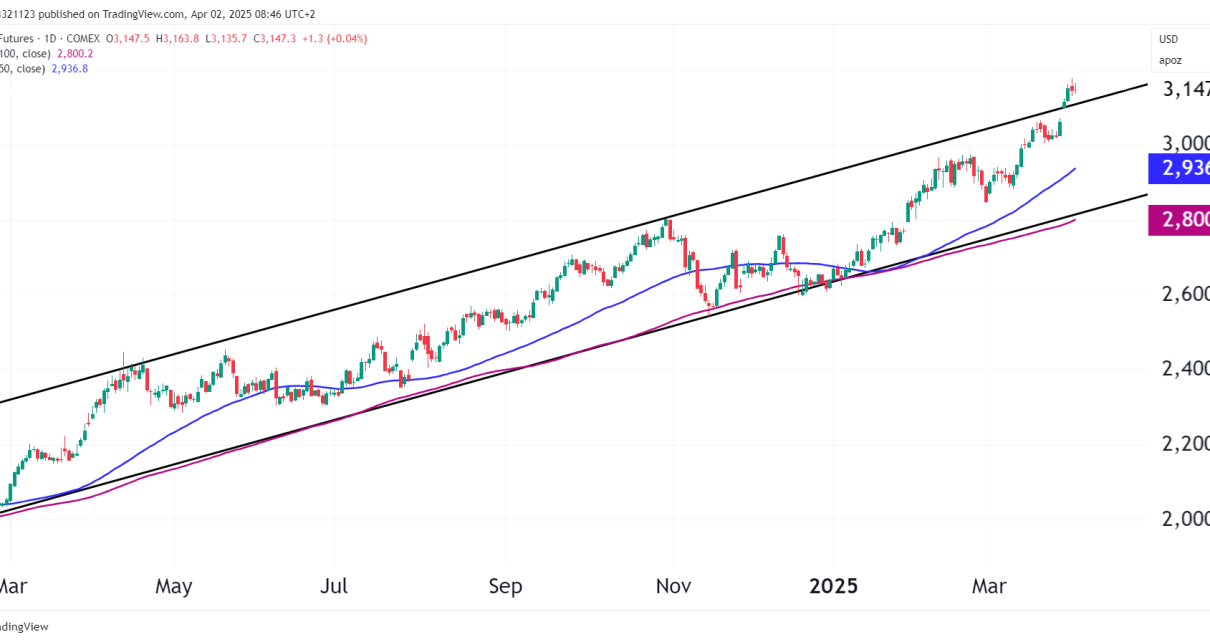
gold futures daily chart
Technical Analysis

Gold futures gap up in early Thursday trade

Introduction Gold futures (GC) have surged to $2,799, marking a strong gap up and a direct test of the all-time high (ATH). This breakout attempt follows the completion of a bullish symmetrical triangle pattern. The market remains highly reactive to macroeconomic conditions, with gold benefiting from inflation concerns, central bank policies, and renewed safe-haven demand. Read More…

Technical Analysis

Euro continues to dip

Introduction The Euro FX futures (6E) continue to struggle against a strengthening U.S. dollar, with price currently trading at 1.04395. The primary driver of the euro’s weakness is persistent dollar strength, fueled by hawkish Federal Reserve policy expectations and renewed investor confidence in the U.S. economy. The euro attempted a rebound from recent 2025 lows Read More…

Fundamental Analysis

Equities Fall as Risk Appetite Drops on Low-Cost Chinese AI Model 

Equities collapsed on Monday, reversing last week’s rally as risk appetite dropped after reports of a new low-cost Chinese AI model. Moreover, Trump announced tariffs on specific goods, increasing the risk of trade wars. Investors eagerly await the FOMC policy meeting for clues on future moves. Last week, Trump failed to give any clear guidance Read More…

Technical Analysis

S&P 500 E-mini futures in turmoil this Monday

Introduction In our previous analysis on January 16, 2025, we identified the potential for ES to continue its rally within the bullish channel with the all-time high (ATH) at 6,154.75 as the next target. Price recently tested this level but failed to break through, forming a double top pattern on the daily chart. Today has Read More…

crude oil technical analysis
Technical Analysis

Crude Oil futures technical analysis – January 24, 2025

Introduction In our previous analysis, we anticipated a potential breakout in crude oil futures (CL) if the price could sustain momentum above certain resistance levels. Since then, crude has rallied sharply but failed to hold above the descending trendline resistance, leading to a pullback below the trendline again. Let’s see what the technicals are telling Read More…

NKD daily chart futures technical analysis
Technical Analysis

Nikkei 225 (NKD) futures stuck in tight range

Introduction Nikkei 225 E-mini Futures (NKD) have been trading within an ascending channel since September 2024. A breakout above 39,958, could pave the way for a test of the all-time high (ATH). Lets take a deeper look at the technicals. Technical analysis overview Channel Structure Support and Resistance Levels Resistance Levels (Upside Targets) Support Levels Read More…