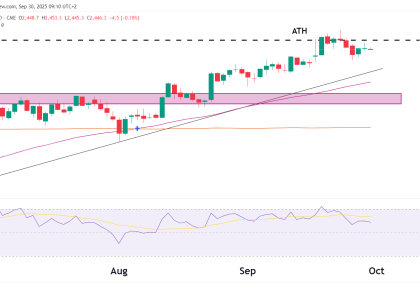
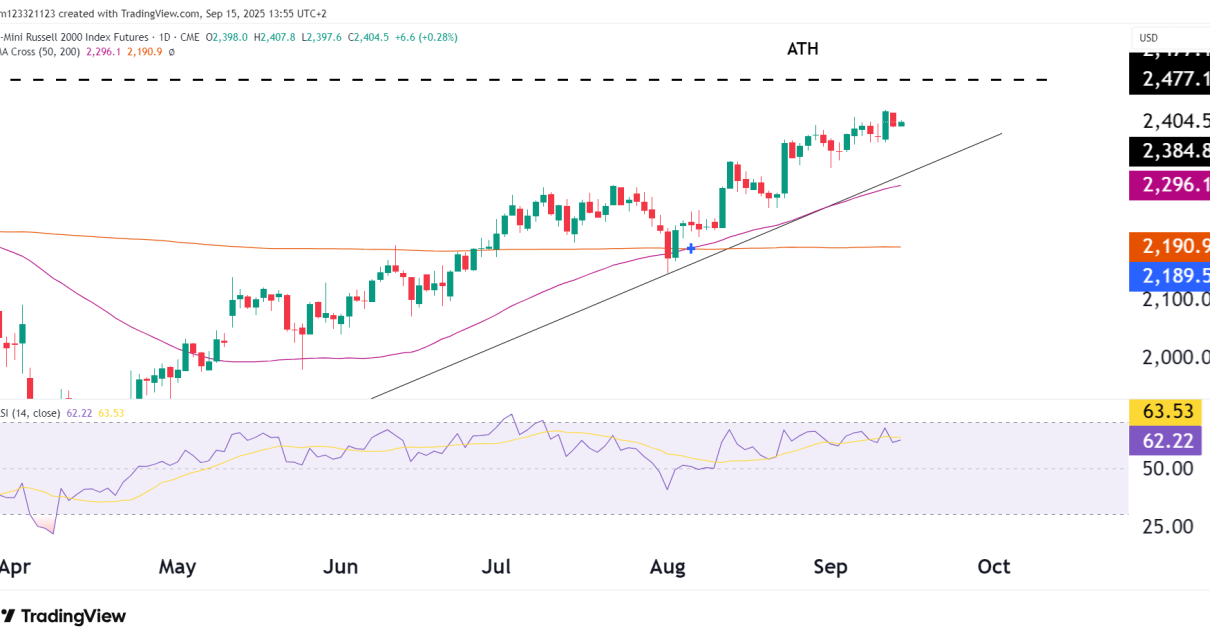
russell 2000 RTY futures OneUp Trader FUnded Trader Program
Technical Analysis

Russell 2000 Futures (RTY) Plunge on Stock Market Correction

Current Trend and Price Action Moving Averages The price is currently hovering near the 200-day moving average (around 2,100). The 50 MA is at the same price and is acting as additional support to the price for now. Support and Resistance Zones Volume Considerations Probable Scenarios Bullish Scenario: Bearish Scenario: If you have any technical Read More…

russell 2000 RTY futures OneUp Trader FUnded Trader Program
Technical Analysis

Frightening evening star pattern on RTY futures

Weekly Chart Starting with the weekly chart, the E-Mini Russell 2000 Index Futures are oscillating within a defined trading range between approximately $1964.5 and $2000, with the ATH at $2463.7. The index is currently testing the upper boundary of this range. A convincing breakout above the range could signal a strong bullish sentiment, potentially targeting Read More…