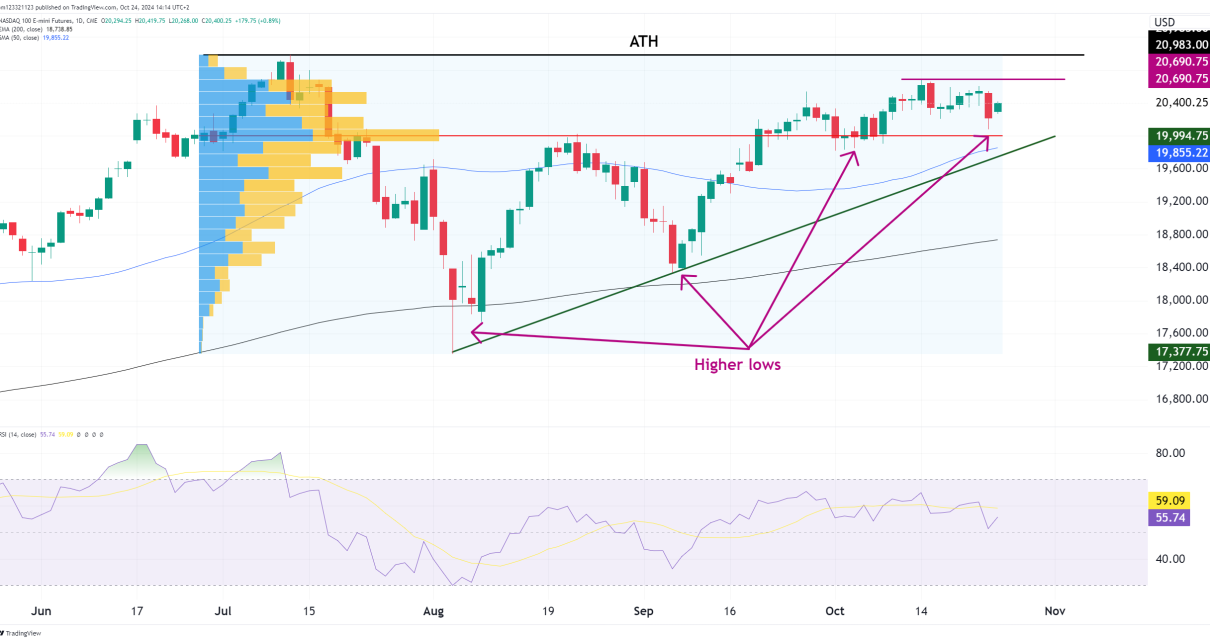
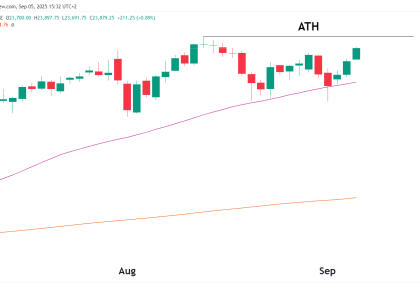
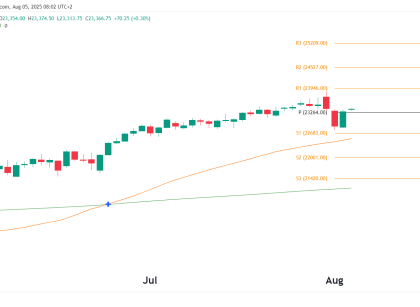
Technical analysis Zones Bull & Bear Cases Bull Case (higher probability) Bear Case (moderate risk) Trade Ideas Breakout Buy Opportunity (Momentum Continuation) Support Bounce Buy (Mean Reversion) Trades to Avoid Final Outlook Timeframe Outlook Bias Commentary Short-Term Consolidation Neutral-Bullish Price digestion after strong run-up Medium-Term Uptrend intact Bullish Higher lows, reclaim of MAs, poised for Read More…
Tag: Nasdaq
Are Nasdaq Futures (NQ) Staging a Comeback?
Introduction The NASDAQ 100 (NQ) has staged a strong short-term recovery from the 19,000 support zone, pushing back above the lower trendline of the long-term rising channel. This move follows a steep correction off the double top formation near 22,000. Technical Breakdown Chart Structure Bull vs Bear Case Bull Case: Bear Case: Trade Opportunities (Short-Term) Read More…
NASDAQ 100 (NQ) plunge with other markets
Introduction The NASDAQ 100 (NQ) futures have fallen sharply since the middle of February. The recent sell-off was triggered by a double top pattern near 22,367.00, pushing the index to test the lower boundary of its long-term ascending channel. With the market now sitting at a key support level, the next move will likely set Read More…
Nasdaq (NQ) consolidate inside triangle, awaiting breakout
Introduction Nasdaq 100 E-mini futures (NQ) are currently trading at 21,464, down 0.95% for the session, as price action consolidates within a symmetrical triangle formation. With the 50-day SMA (21,483.66) acting as short-term support and the 200-day SMA (20,040.68) providing long-term support, Nasdaq futures are coiling within a tightening range. Lets see what the technicals Read More…
NASDAQ 100 technical analysis – January 21, 2025
Introduction The NASDAQ 100 E-mini Futures (NQ) are trading at 21,703.75, continuing their upward trajectory following the recent inauguration of President Trump. Traders and investors are pricing in optimism on pro-growth economic policies, contributing to the strength in equities. Technical Analysis Overview Trend and Structure: Support and Resistance Levels Resistance Levels: Support Levels: Indicators Analysis Read More…
Nasdaq Futures (NQ) Technical Analysis
Introduction Its been exactly 400 days since the the 50 simply moving average crossed back above the 200 simple moving average in a 100% rally from bottom to the top in NQ. The index has rallied hard and technicals are still pointing to higher prices as the bulls over power the bears. Technical analysis though Read More…