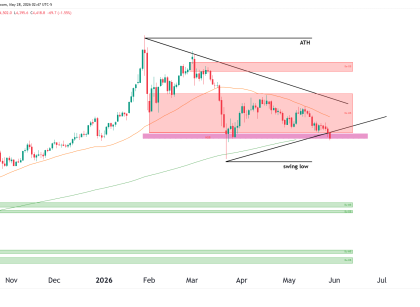
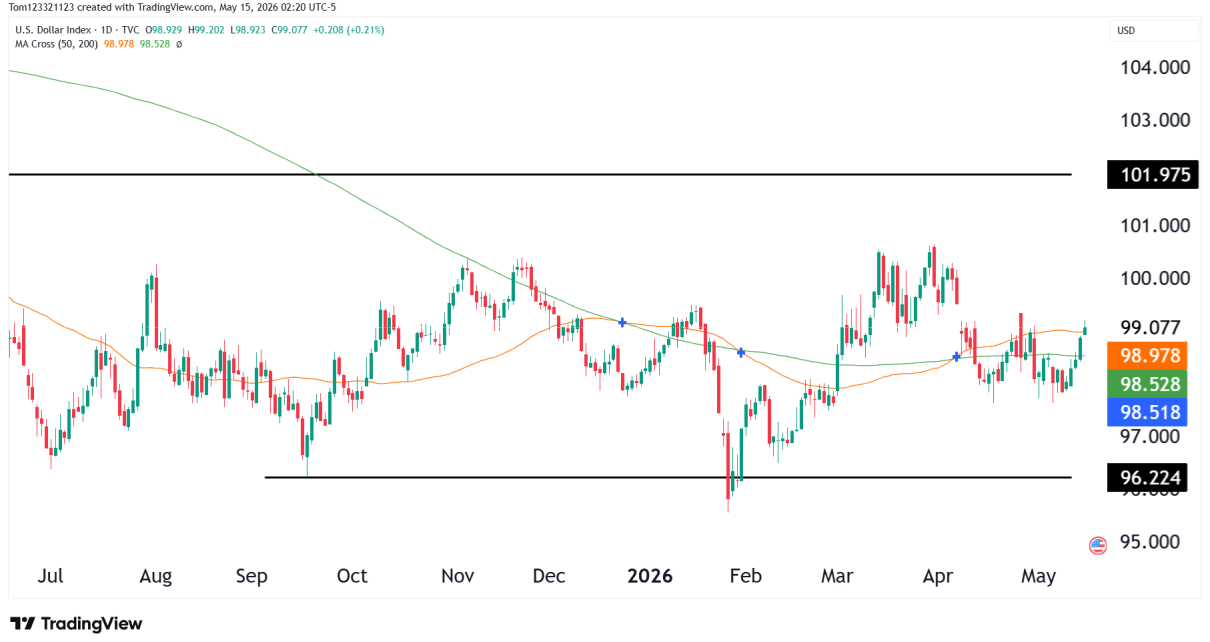
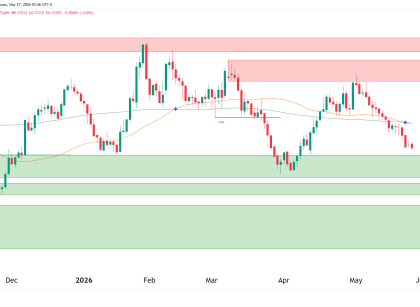
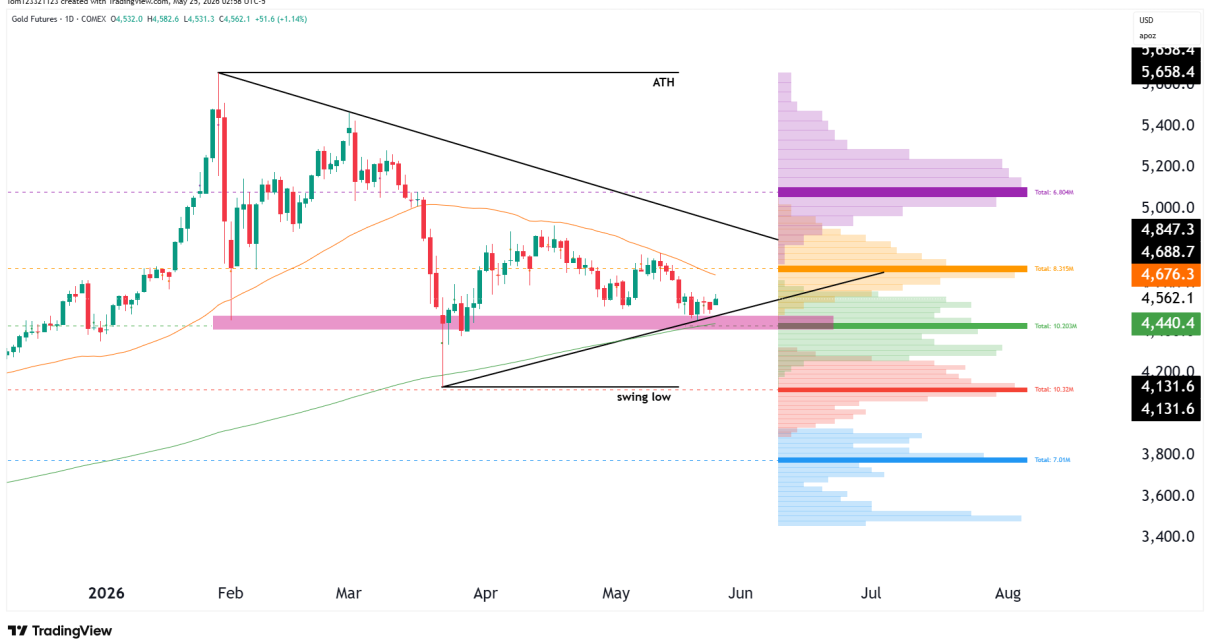
Fundamental Analysis

Gold Bounces Back, Pausing the Jobs Report Dip

Gold prices rose on Tuesday, pausing a decline that started on Friday after the US jobs report. The recovery came as the dollar and Treasury yields pulled back from recent highs. However, this decline might be short-lived if fundamentals continue pointing to delayed rate cuts in the US. Fed rate cut expectations (Source: Bloomberg) Notably, Read More…

Fundamental Analysis

Gold Climbs to Two-Week Peak Amid Declining Dollar and Treasury Yields

Gold rose on Tuesday, reaching a two-week high as the dollar and Treasury yields declined. Investors were focused on the looming Fed decision on Wednesday, where they expect the central bank to keep rates unchanged. The big question for gold traders is when the Fed will start cutting rates. When interest rates in the US Read More…

Strategies Trading Tips

Scalp Trading vs Day Trading Strategies

Introduction to Scalp Trading and Day Trading Scalp trading and day trading are two prominent trading strategies with very distinct approaches. Scalp trading involves making many trades in a single day to capture small price movements. It requires close market monitoring and high precision. Day trading refers to buying and selling financial instruments within the Read More…

European-Stocks-Catch-the-Bullish-Message-from-Euros-Momentum
Technical Analysis

Euro Bears Start Taking Control (6E): Technical Outlook

Weekly Chart Analysis for EURO FX Futures:The weekly chart shows price oscillating between a tight range of support and resistance. The Moving Average Convergence Divergence (MACD) is flat and close to the zero line, indicating a lack of strong momentum in either direction. The support zone around 1.05900 is critical, and a break below would Read More…

Nasdaq 100 index futures (NQ)
Technical Analysis

NASDAQ Futures (NQ) firmly bullish

Weekly Chart Analysis for NASDAQ 100 E-mini Futures:The weekly chart shows price in a clear ascending channel pattern, with NQ positioned in the upper half of the channel. The Relative Strength Index (RSI) is sitting in overbought territory, however. The all-time high (ATH) stands as the ultimate resistance level, which price has closed above in Read More…