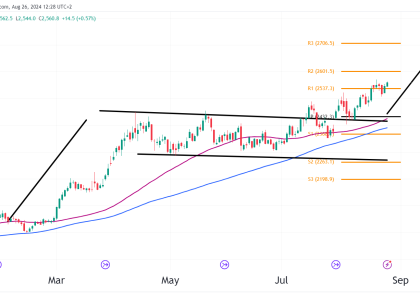
gold technical analysis futures oneup trader funded trader program
Technical Analysis

Gold Futures (GC) multi-timeframe analysis

The weekly chart shows a triple-top reversal pattern forming, with resistance around $2088. This is a pivotal zone – if price can break out above $2088 decisively, it would invalidate the bearish pattern and imply an upside breakout. However, failure to break resistance could confirm the pattern and precede a downward move. The weekly RSI Read More…

gold technical analysis futures oneup trader funded trader program
Fundamental Analysis

Gold Halts Decline, Gears Up for US Non-Farm Payrolls

On Thursday, gold stabilized after a four-session decline as investors prepared for the upcoming US non-farm payroll data. This report could impact the Federal Reserve’s interest-rate decisions. Jim Wyckoff, senior analyst at Kitco Metals, mentioned the need for a fresh spark in the gold market to start a rally. According to Wyckoff, stronger jobs data Read More…

gold technical analysis futures oneup trader funded trader program
Fundamental Analysis

Gold Prices Rise on Optimism for March Federal Reserve Cut

Gold prices rose on Thursday as US economic data heightened expectations of a Federal Reserve interest rate cut in March next year. Data revealed a 4.9% annualized growth in US gross domestic product for the last quarter, a revision from the initially reported 5.2%. Moreover, there was a slight increase in weekly jobless claims. Spot Read More…

gold technical analysis futures oneup trader funded trader program
Technical Analysis

Gold Futures (GC) Technical Analysis Update

Introduction Gold Futures have shown remarkable resilience, breaking through a triple-top pattern and scaling above the previous all-time high in recent weeks. The only hurdle facing the bulls is the weekly bearish close from two weeks prior when price broke above the high, as we analyzed here. Weekly Chart Analysis The weekly chart illustrates a Read More…