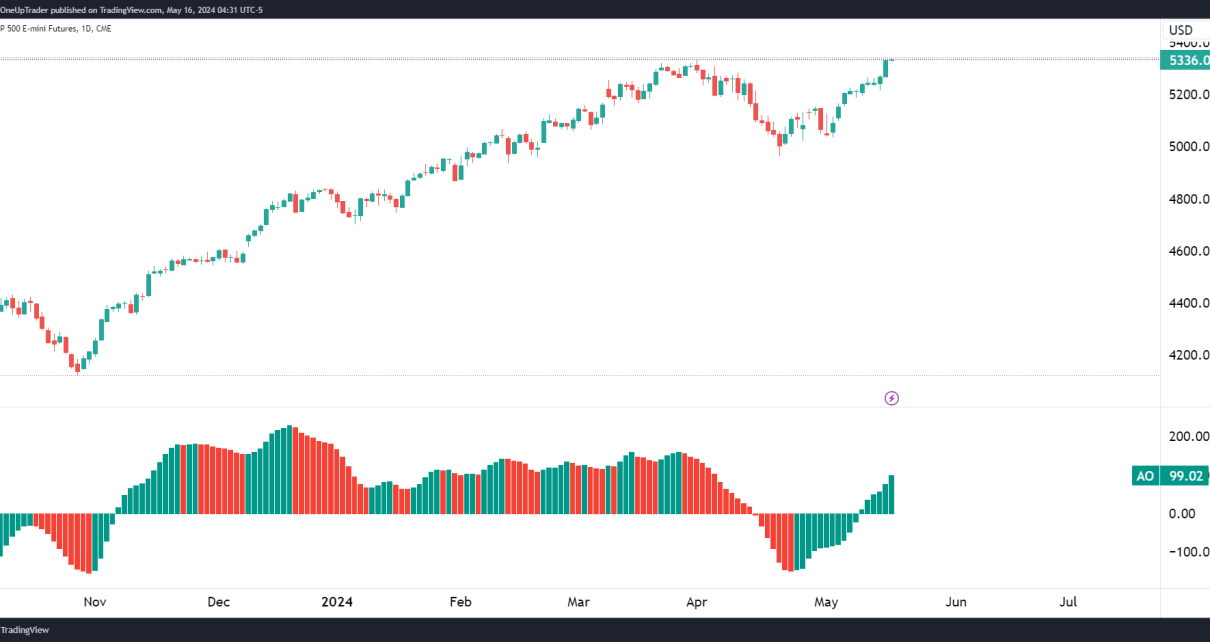
On Friday, currency futures rose slightly, with the dollar dipping as December’s inflation data showed a modest rise but indicated a downward trend. This will likely prompt the Fed to cut interest rates by mid-year. Trading slowed in the afternoon before the weekend, with investors preparing for a busy week ahead. The US will release Read More…
Tag: futures trading
Euro Bears Start Taking Control (6E): Technical Outlook
Weekly Chart Analysis for EURO FX Futures:The weekly chart shows price oscillating between a tight range of support and resistance. The Moving Average Convergence Divergence (MACD) is flat and close to the zero line, indicating a lack of strong momentum in either direction. The support zone around 1.05900 is critical, and a break below would Read More…
Interest Futures (ZB) Tumble as US Economy Surges Beyond Expectations
Interest futures (ZB) fell on Thursday after a report showed the US economy expanded faster than expected. Additionally, there were indications that inflation was easing. Investors reacted to the faster-than-expected economic growth data by bidding up prices, causing Treasury yields to fall. Charu Chanana, head of currency strategy at Saxo in Singapore, stated that US Read More…
NASDAQ Futures (NQ) firmly bullish
Weekly Chart Analysis for NASDAQ 100 E-mini Futures:The weekly chart shows price in a clear ascending channel pattern, with NQ positioned in the upper half of the channel. The Relative Strength Index (RSI) is sitting in overbought territory, however. The all-time high (ATH) stands as the ultimate resistance level, which price has closed above in Read More…
Gold Prices Edge Up Ahead of Key US Economic Reports
On Tuesday, gold prices rose slightly as investors awaited a series of US economic data releases this week. The data is expected to provide insights into the Federal Reserve’s plans for interest rate cuts. Daniel Pavilonis, senior market strategist at RJO Futures, commented that the gold market is hovering just above the $2,000 mark, with Read More…
Greyscale dumps Bitcoin; what now?
Weekly Chart Analysis: Price has formed a large rounding bottom pattern and parabolic curve, typically considered a bullish reversal signal. The price was approaching the all-time high (ATH) resistance zone, near $69,435, before swiftly pulling back after greyscale started dumping on the market. We should monitor this level closely; a decisive weekly close above the Read More…


