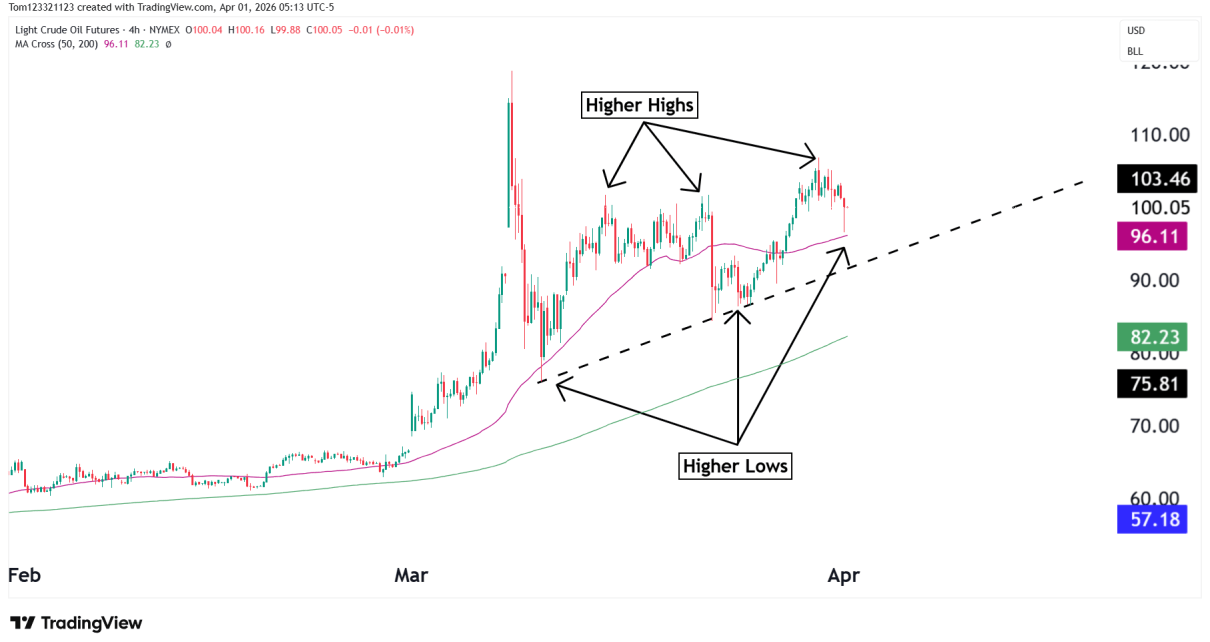
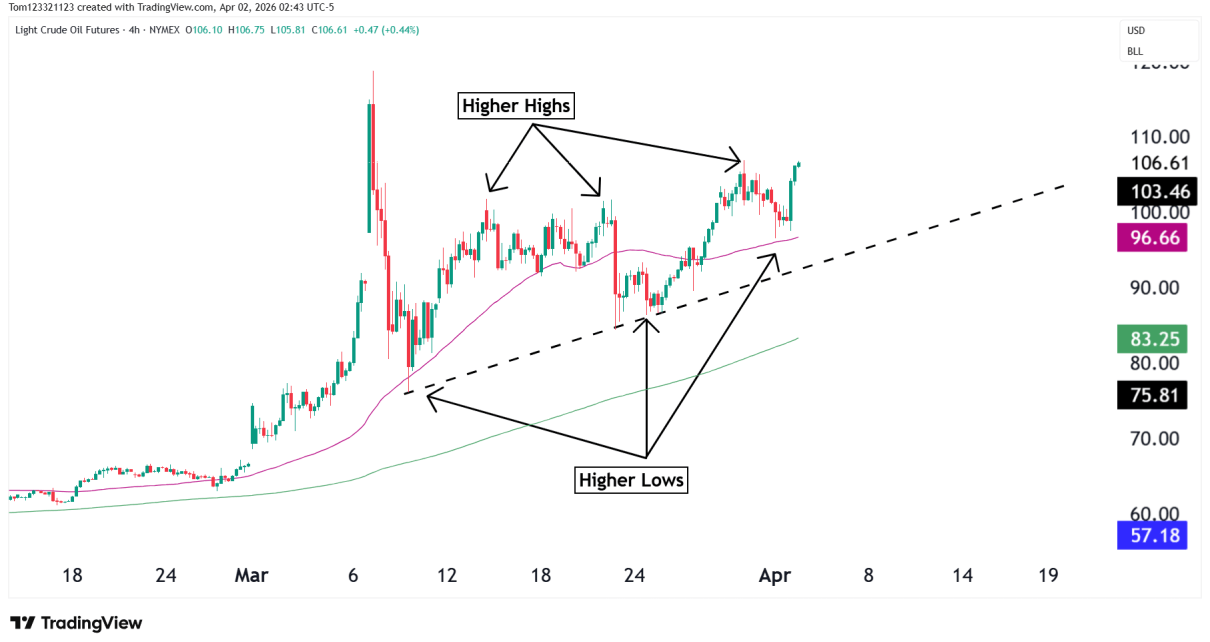
Technical Analysis

Euro FX Futures: Key Technical Levels and Trade Setups to Watch

As the Dollar continues to fall, eyes are on the Euro and how it will weigh up against the rest of the world currencies. In this week’s technical analysis, we take a look at the monthly, weekly, and daily charts. We also look for trade ideas and ways to play the market. Monthly Chart The Read More…

Technical Analysis

S&P 500 E-mini Futures: Key Levels and Trade Setups

Overview The charts below give us monthly, weekly, and daily S&P 500 E-mini Futures (ES) technicals. We will analyze the key levels, trends, and indicators to establish potential trade setups. Monthly Timeframe Analysis The monthly chart reveals a long-term uptrend, with the price consistently forming higher highs and higher lows—a bullish signal. The recent high Read More…

Fundamental Analysis

Gold Prices Rise on Optimism for March Federal Reserve Cut

Gold prices rose on Thursday as US economic data heightened expectations of a Federal Reserve interest rate cut in March next year. Data revealed a 4.9% annualized growth in US gross domestic product for the last quarter, a revision from the initially reported 5.2%. Moreover, there was a slight increase in weekly jobless claims. Spot Read More…

Crude Oil Futures
Fundamental Analysis

Oil Prices Settle Higher Amidst Global Tensions

On Wednesday, oil prices settled slightly higher amid concerns over global trade disruption. There were attacks on ships in the Red Sea by Yemen’s Iran-aligned Houthi forces. Meanwhile, a surprise US crude inventory build, larger-than-expected fuel stock gains, and record domestic oil production limited price gains.  The US Energy Information Administration reported increases in US Read More…

Technical Analysis

E-Mini Russell 2000 Futures (RTY) Technical Analysis

Introduction The E-Mini Russell 2000 Index Futures are approaching an all-time high (ATH). The technical analysis of both weekly and daily charts are catching up to the bigger indices that have already broken their previous highs. Weekly Chart Analysis On the weekly chart, we see that the RTY futures are within a symmetrical triangle pattern, Read More…