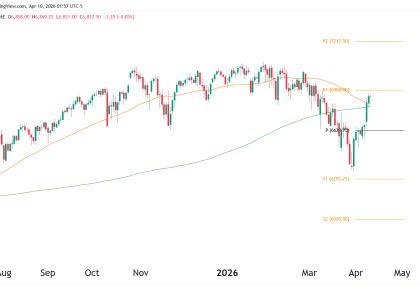
Weekly Chart The weekly chart shows how significant the false break has been in GC with bulls still unable to push through. The recent ‘Failed Attempt’ to break above this level is beginning to show signs of exhaustion from the bulls. Immediate support is seen at the rising trendline, currently near the 1974.4 mark. A Read More…
Tag: Futures market
Euro FX futures (6E) technical analysis trades both directions
Weekly Chart Analysis: The weekly chart exhibits a consolidation pattern with a clear ‘Point of Control’ at approximately 1.09220. This level represents the price with the highest volume traded over the analyzed period and acts as a significant area of balance between supply and demand. The presence of a ‘Low Volume Node’ below this range Read More…
Equities Retreat on ECB’s Rate Cut Warning
On Monday, European equities closed lower as government bond yields increased, following warnings from ECB officials against premature rate cuts. Meanwhile, the US equity market was closed due to a public holiday. Government bond yields rose across the region after ECB’s chief economist Philip Lane cautioned on Saturday that rapid rate cuts could lead to Read More…
Bullish price action in Dollar (DXY)
Weekly Chart We observe a clear support zone around the 102.00 level, which price is currently testing. If we see a strong bullish response at this zone, we could anticipate a rally towards the upper resistance near 114.90. However, a break below this support could lead us to look for further downside targets near the Read More…
Currency Futures Fall Despite Anticipated Early US Rate Cut
On Friday, currency futures fell despite a drop in US producer prices in December, increasing the likelihood of an early US rate cut. At the same time, the dollar fell after rising during the day due to safety buying following US and British military actions in Yemen. US producer prices (Source: Bureau of Labor Statistics) Read More…
Frightening evening star pattern on RTY futures
Weekly Chart Starting with the weekly chart, the E-Mini Russell 2000 Index Futures are oscillating within a defined trading range between approximately $1964.5 and $2000, with the ATH at $2463.7. The index is currently testing the upper boundary of this range. A convincing breakout above the range could signal a strong bullish sentiment, potentially targeting Read More…