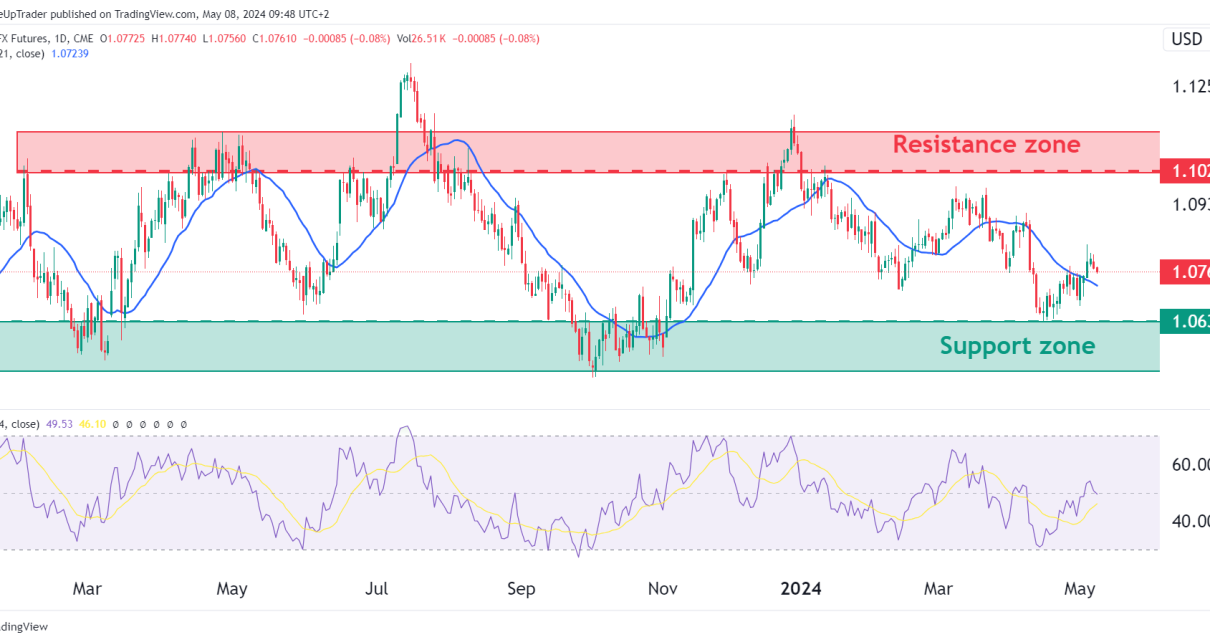
6E euro FX futures daily cahrt technical analysis
Technical Analysis

Euro FX Futures Technical Analysis

Chart Overview In this analysis, we’ll take a closer look at the daily chart of the Euro FX Futures, focusing on the price movements as 6E has been stuck in a range for over one year. This range is between well-defined support and resistance zones, with the resistance zone at 1.10265, and the support zone Read More…

6E euro dollar after donald trump victory
Technical Analysis

Euro FX futures (6E) technical analysis trades both directions

Weekly Chart Analysis: The weekly chart exhibits a consolidation pattern with a clear ‘Point of Control’ at approximately 1.09220. This level represents the price with the highest volume traded over the analyzed period and acts as a significant area of balance between supply and demand. The presence of a ‘Low Volume Node’ below this range Read More…

6E euro dollar after donald trump victory
Technical Analysis

EURO FX futures (6E) bulls & bears fight it out

Weekly Chart Analysis:The weekly chart shows the price fluctuating within the Gaussian channel. The recent trend is sideways, with the price fluctuating between the upper and lower bands of the channel. The ‘Higher High’ (H) and ‘Lower Low’ (L) indicate a lack of a clear long-term trend. The RSI is at 54.37, which is neutral, Read More…