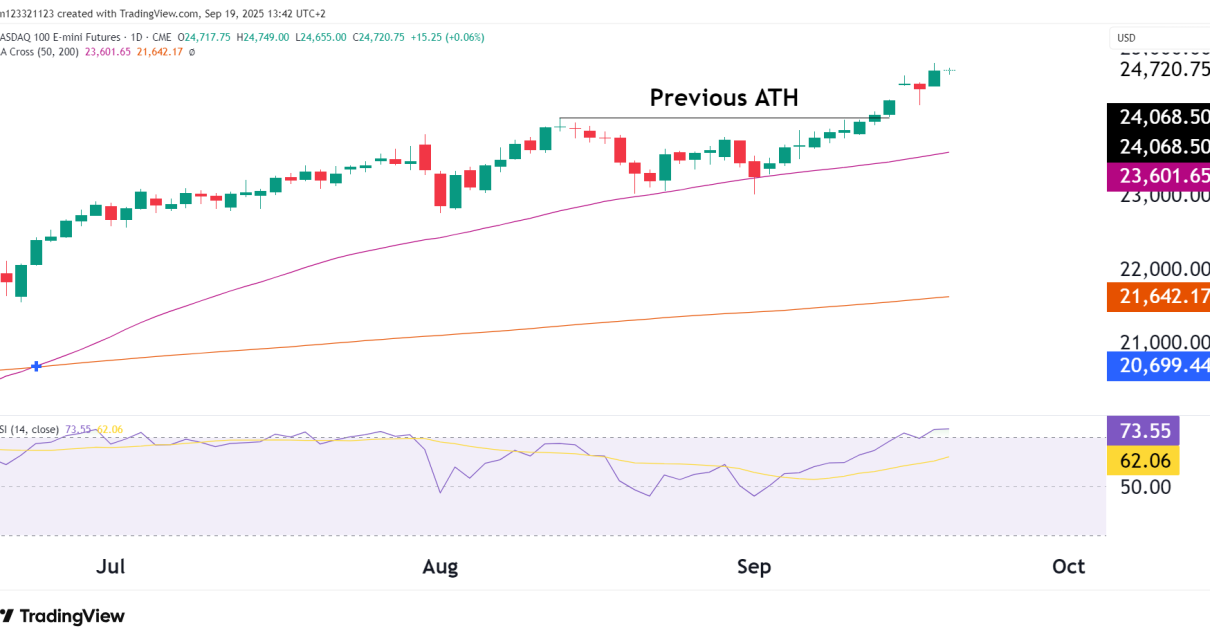
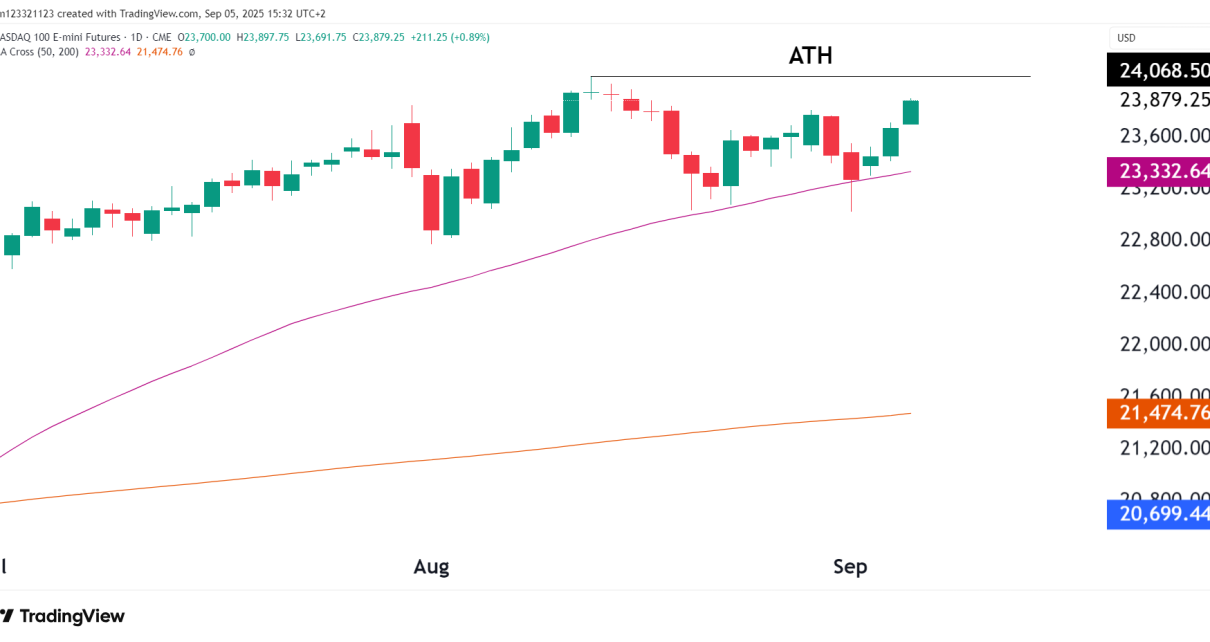
Nasdaq 100 index futures (NQ)
Technical Analysis

NASDAQ 100 (NQ) Trade Opportunities

Important Points All-Time High (ATH) Resistance: Support and Resistance Levels: Price Action: Trade Opportunities: Bullish Scenario: Bearish Scenario: Risk Management: Final Call: Overall, the chart is showing a bullish bias, with a key decision point around the ATH. Traders should watch for either a breakout or a rejection to determine the next move.

Technical Analysis

NASDAQ Futures (NQ) Surge Incoming?

Price Action and Trend NQ, like all other equity markets, has been in a strong uptrend since October 2023. However, we’ve recently seen a sharp pullback from the all-time high of around 20,983.00, and now could be the time to look to take long positions. Support and Resistance Moving Averages The price is currently between Read More…

Technical Analysis

NASDAQ (NQ) Key Technical Analysis Trades

NASDAQ Chart Overview In this chart, we’re looking at the NASDAQ 100 E-mini Futures (10-minute intervals) along with the Simple Moving Average (SMA), Relative Strength Index (RSI), and Volume Profile Visible Range (VPVR) indicators. Price Action and Technical Patterns Channel and Breakout Analysis We can see that the price was trading within an ascending channel, Read More…

Technical Analysis

Technical Analysis for NASDAQ 100 E-mini Futures

Weekly Chart Key Levels to Watch on the Weekly: Daily Chart Key Levels to Watch on the Daily: Potential Trades: It’s essential to monitor these levels and adjust strategies accordingly. The rising wedge and RSI divergence should be watched closely for signs of a potential reversal. Remember to manage risks effectively, as markets can always Read More…