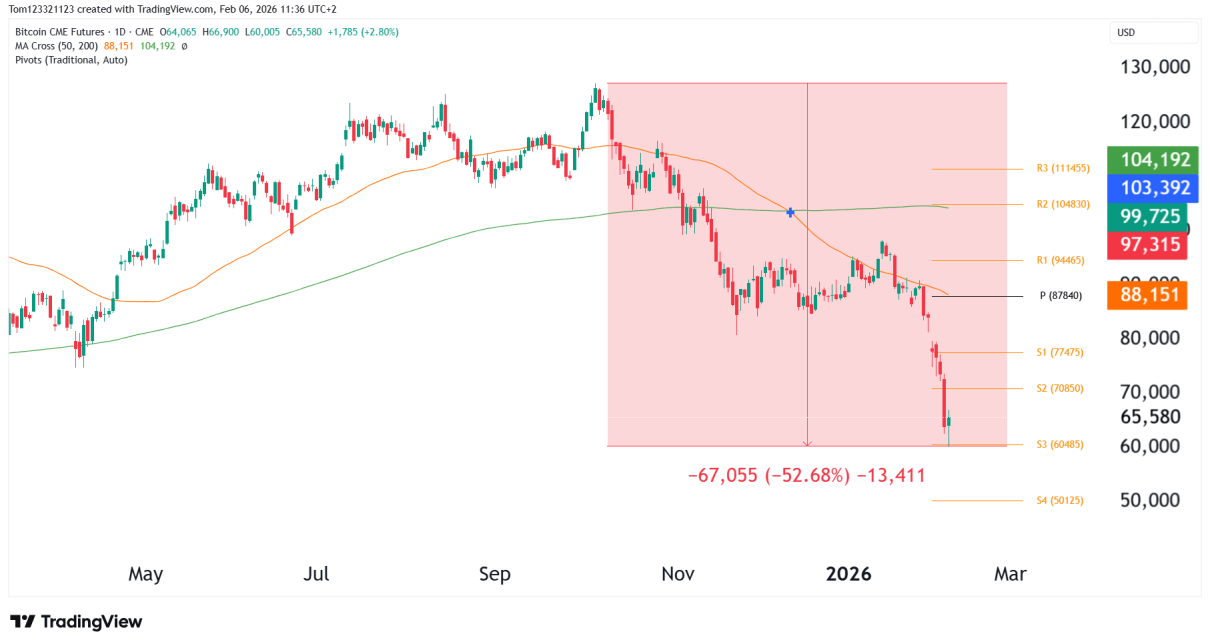
bitcoin weekly chart technical analysis after donald trump pump
Technical Analysis

Bitcoin is pumping thanks to Donald Trump

Introduction A trader on TradingView has shown us an interesting long-term analysis for Bitcoin, targetting a peak between $113,000 and $120,000 USD. This pump is due to Donald Trump’s pro-crypto policies and a favorable regulatory outlook. Bitcoin has doubled in value this year and surged 40% since the U.S. election, as investors get bullish on Read More…

Technical Analysis

Bitcoin 8% Away From New All-Time-High!

Bitcoin Bulls Buy Back Bitcoin has maintained its position as the leading cryptocurrency in 2024, building on the momentum generated by the historic approval of spot Bitcoin ETFs in January. The digital asset, which started the year trading around $45,000, has rallied 58% since January. Wall Street’s traditional finance giants, including BlackRock and Fidelity, have Read More…

futures trading strategies for beginners
Technical Analysis

Bitcoin Futures Technical Analysis (CME, Daily Chart)

Technical Analysis: Descending Channel: The primary structure in play is a descending channel, which has kept price action constrained between roughly $75,000 and $50,815. Until Bitcoin can decisively break out of this channel, the prevailing trend remains slightly bearish in the medium term but still bullish in th belong term. Potential Support Levels: Short-Term Outlook: Read More…

futures trading strategies for beginners
Technical Analysis

Bitcoin Crashes 14% in early Monday trade

Introduction Bitcoin has plunged to levels not seen since February, briefly dipping below the $50,000 mark. This dramatic sell-off comes just days after Bitcoin was flirting with the $70,000 level. This is part of a broader market sell-off triggered by renewed recession fears, as even the big indices started falling on Monday. Investors, already on Read More…