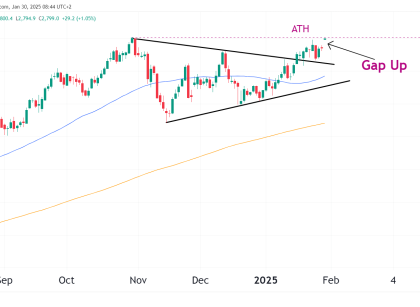
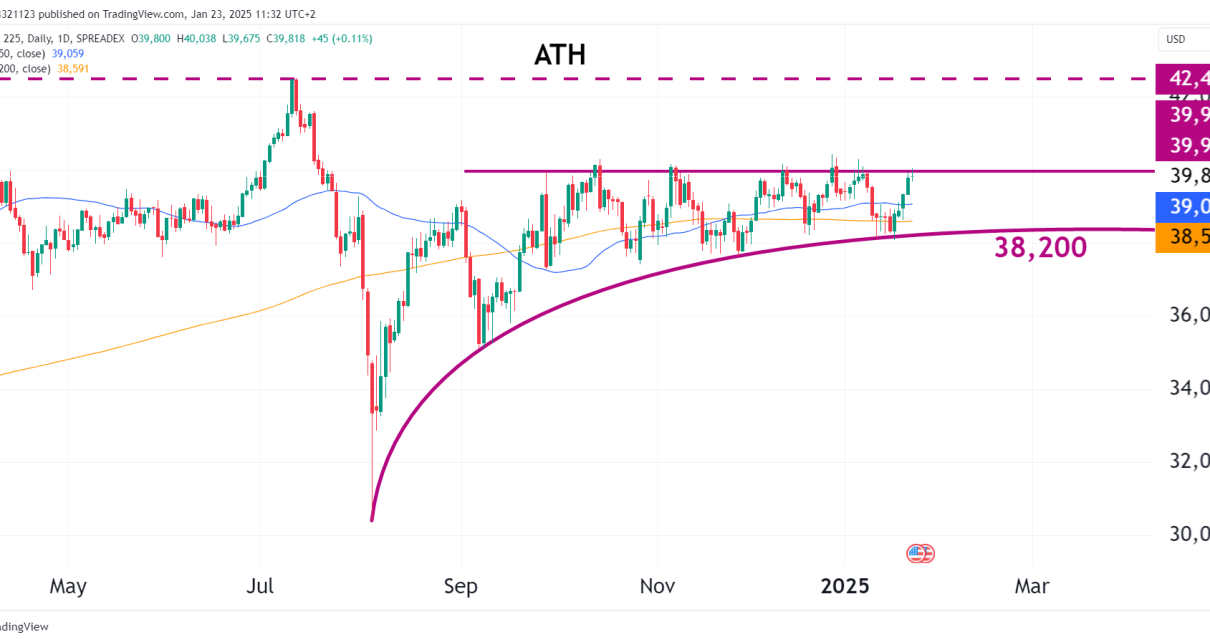
Introduction Following our previous analysis from November 2024, Bitcoin hit our anticipated $110,000 target, delivering a massive 30% rally. However, since then, the market is showing signs of exhaustion, with price pulling back to around $93,690 (-15%). Technical Analysis Bearish Divergence on RSI Short-term Retracement Underway Moving Averages as Support Bullish Case: Higher Highs in Read More…
Technical Analysis
Euro FX Futures (6E) Technical Analysis – December 18, 2024
Chart OverviewEuro FX Futures (6E) remain under pressure as the Dollar continues to rise. The Euro has been held at the support zone at 1.063 after the Trump victory rally of DXY. Weak momentum, confirmed by a declining RSI, raises the likelihood of further downside if bulls cannot push prices back into the prior range. Read More…
NASDAQ 100 E-mini Futures Daily Technical Analysis
Chart OverviewThe Nasdaq 100 E-mini Futures are showing signs of exhaustion at current levels, as the price action is forming a rising wedge pattern—a bearish signal when it appears at the top of a rally. With the price sitting near 21,800, the market appears stretched. Let’s break down what this could mean for traders and Read More…
Gold Futures (GC) Technical Analysis – December 11, 2024
Building on the November 25 analysis, where we saw a potential Head and Shoulders (H&S) forming, the updated chart tells a different story. The $2,542.3 “Last Support” held firm, and price action has invalidated the H&S pattern, leading to a false alarm on the formation. The bullish momentum has pushed prices back toward $2,707.6, so Read More…
S&P 500 E-mini Futures (ES) Technical Analysis – December 9, 2024
Chart OverviewSeven days since the last analysis, the S&P 500 E-mini Futures remain firmly bullish. The price is steadily advancing toward the 6,250 target due to the influence of positive sentiment surrounding Trump’s presidency and his pro-growth policies. Let’s evaluate the updated price action and provide insights into what might unfold next. Key Developments Over Read More…
Crude Oil Futures Technical Analysis – December 5, 2024
Chart OverviewCrude Oil prices are still sitting in the yearly support zone around $67-$69. The market is watching closely for a breakout above $75.30, which aligns with the descending trendline resistance. Adding bullish momentum is the recent news of U.S. crude oil stockpiles falling more than expected, sparking hopes for tighter supply and higher prices. Read More…


