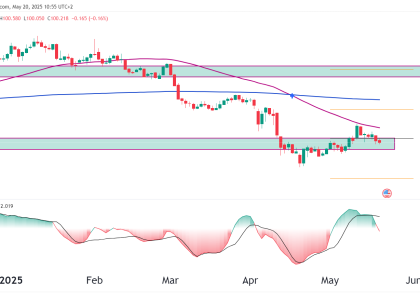
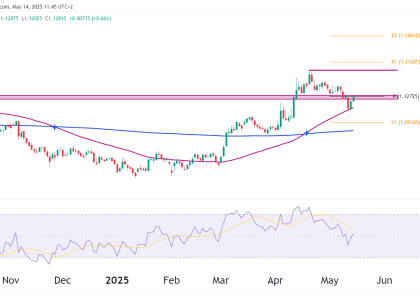
Monthly Chart The monthly chart gives us a good idea of where CL has been sitting since the start of 2023. The longer the price sits in the tight range the stronger the break out will be but at the moment CL is being pushed around a lot by fundamentals. The volume profile point of Read More…
Technical Analysis
Buy Opportunity in Dow Jones Futures (YM)
Introduction The Dow Jones has been in a tight ascending triangle on the weekly chart as all US indices continue to surge despite massive geopolitical tensions. At the moment, YM is bouncing off a low and could possibly look to be moving higher for the next few weeks. Lets take a look at the chart Read More…
Gold is Surging. Technical Outlook
Introduction Gold has once again broken above its all-time high this year, surging past $2,500 per ounce. Think about this for a moment. We have Gold and equities surging at a time when the work is on the brink of war. Investors don’t know where to put their money anymore. Its a time we must Read More…
Japanese Yen (6J) Bears load up on shorts
Weekly Chart There is an evening star pattern on the weekly chart which hasn’t closed yet. J6 bears are hoping this weeks trading will close red because it will likely lead to a big sell off in the Yen most likely back to previous support levels which is a 9% drop from here. The weekly Read More…
Russell 2000 Futures (RTY) Plunge on Stock Market Correction
Current Trend and Price Action Moving Averages The price is currently hovering near the 200-day moving average (around 2,100). The 50 MA is at the same price and is acting as additional support to the price for now. Support and Resistance Zones Volume Considerations Probable Scenarios Bullish Scenario: Bearish Scenario: If you have any technical Read More…
Short Trade Opportunity on Euro Futures (6E)
Weekly Chart The Euro 6E futures were rejected after moving into the resistance zone at 1.10265. This zone has successfully stopped the bulls from pushing prices higher since the start of 2023, and this may present us with a short opportunity. Let’s look at the daily chart first, though. Daily Chart Short Trade Opportunity in Read More…