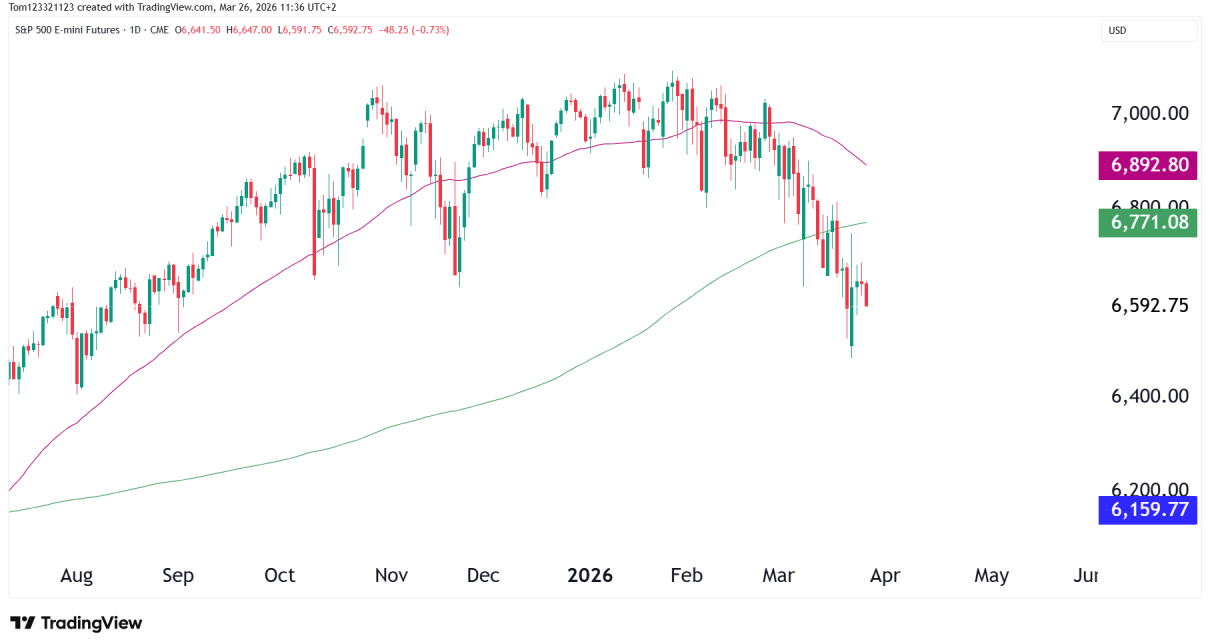
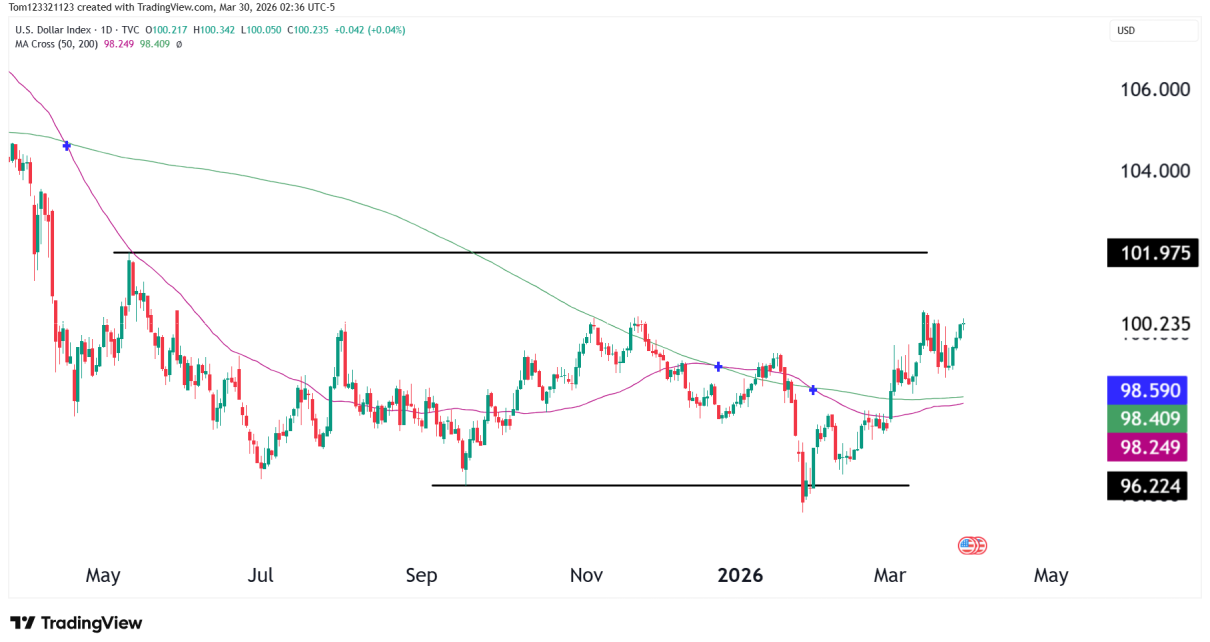
After a sharp drop of 2-3% to the $4,850 area, gold futures have recovered losses in Wednesday’s Asian session. Buyers keep testing the $5,000 psychological level. The recent rise is likely a technical correction and a repositioning ahead of important US macroeconomic events, not the start of a new trend. Near-month futures have dropped sharply, Read More…
Analysis
S&P 500 (ES) Technical Analysis, 17 February 2026
Introduction S&P 500 E-mini futures have pulled back from the 7,000 area after multiple tests of resistance. This was the formation of the ATH too, and now the price appears to be in a range between 6,800 and 7,000. There is some profit-taking happening which is why ES is no longer forming higher highs and Read More…
Tech Weakness Drags US Equities Lower Ahead of Fed-Heavy Week, Global Shift
US equities fell slightly on Monday in a light trading day amid the US Presidents’ Day holiday. Investors were still wary of technology stocks and preparing for a week full of data that could test the strength of the long-running US equity bull run against the soaring overseas markets. The Nasdaq 100 futures fell about Read More…
Dow Jones Futures (YM) Technical Analysis, 16 February 2026
Introduction Dow Jones E-mini futures continue to grind higher, pressing back toward recent highs near 50,000. Unlike the more volatile NASDAQ, the Dow’s rally has been steadier, a trend followers dream. However, momentum is no longer expanding aggressively. The market is advancing but doing so in a more controlled, mature fashion. Each time the 50 Read More…
Currency Futures Slip as Dollar Recovers on a Mute Day
Currency futures are under subdued pressure as US inflation data shows cooling, with CPI at 2.4% YoY and 0.2% MoM, bolstering bets on later Fed cuts. CME FedWatch expects two 25-bp cuts this year, mostly after June. Key takeaway: Cooling inflation and delayed Fed action keep USD strong in the short term but may weaken Read More…
NASDAQ (NQ) Technical Analysis, 13 February 2026
Introduction NASDAQ 100 E-mini futures are showing signs of exhaustion after forming a double top structure near the 26,000 area. Price has now rolled over from that resistance zone and is slipping back below the 50-day moving average. Momentum has weakened noticeably, and the trend is no longer higher highs and higher lows but a Read More…


