

Introduction
The U.S. Dollar Index (DXY) continues to trade lower as confidence continues to diminish in the US. The chart looks like the price might be turning around for a bit after reaching oversold on the RSI, but as we know, the Dollar is influenced almost entirely by the fundamental picture. Let’s see if we can find a balance between both for the Dollar chart.
Fundamental Drivers Affecting the Dollar
- Federal Reserve Rate Expectations:
- Recent economic data has fueled speculation that the Fed may slow down its tightening cycle or even pivot toward rate cuts.
- Market-implied probabilities for a rate cut later this year have increased, putting downward pressure on the dollar.
- Macroeconomic Data:
- CPI inflation data came in softer than expected, reducing the urgency for further hikes.
- Retail sales and consumer sentiment indicators have weakened, signaling potential economic slowdown concerns.
- Geopolitical & Political Factors:
- Ongoing discussions regarding U.S. fiscal policy and debt concerns may be weighing on confidence in the dollar.
- Uncertainty surrounding global trade policies and potential diplomatic tensions, including U.S.-China relations, could influence capital flows.
Technical Analysis – Daily Chart
- Trend & Moving Averages:
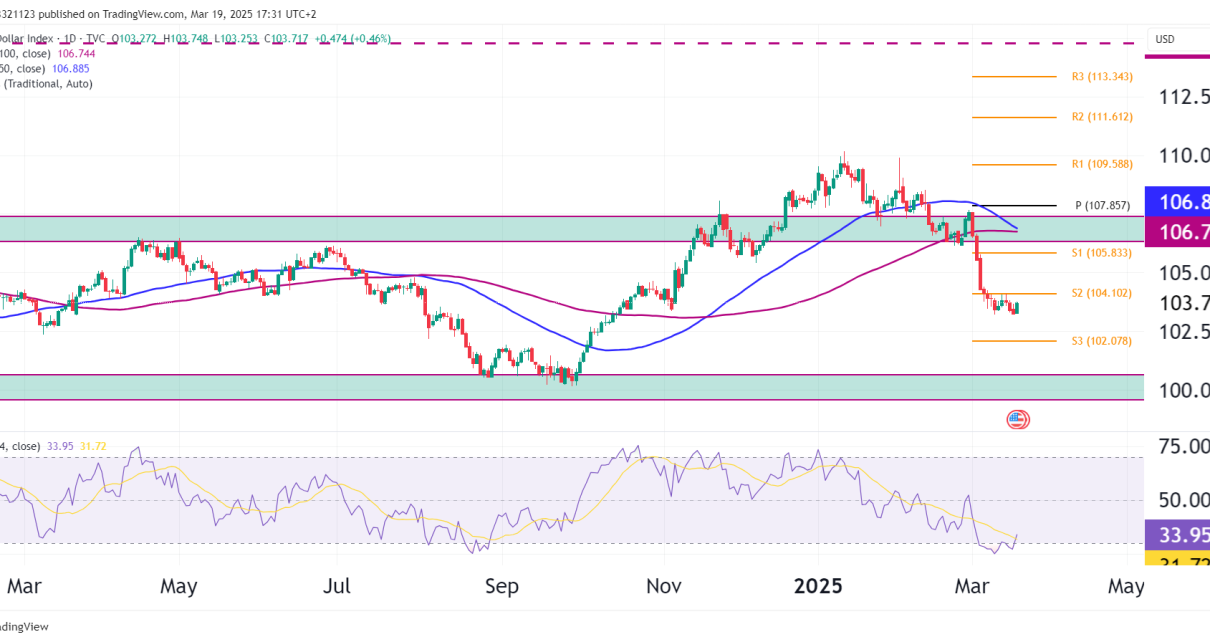
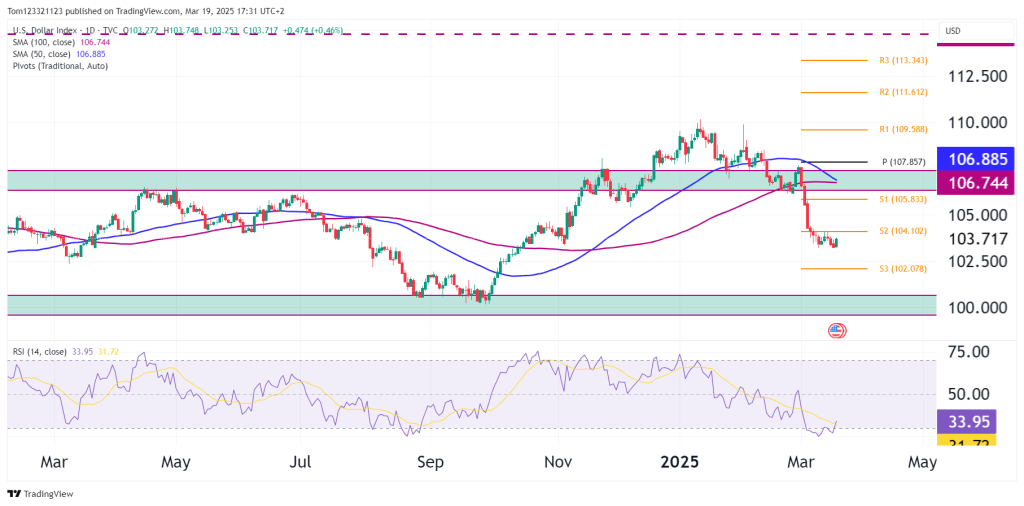
- The DXY is below both the 50-day (106.88) and 100-day (106.74) SMAs, confirming a bearish trend.
- The breakdown below the 106 support zone led to an acceleration of selling.
- Key Support & Resistance Levels:
- Support:
- 103.70 (Current price area) – Holding for now, but a break lower could target 102.50 (S3 pivot).
- 100.00 Psychological Level – A major support level that, if tested, could trigger a stronger reaction.
- Resistance:
- 104.10 (S2 Pivot Level) – First level to watch on a recovery attempt.
- 105.83 (S1 Pivot Level) – A key zone where the prior breakdown occurred.
- 106.74 – 106.88 (50 & 100 SMAs) – A major resistance confluence; a move above would suggest trend stabilization.
- Support:
Outlook & Trade Considerations
- Bearish Case:
- If the dollar fails to reclaim 104.10, further downside toward 102.50 remains in play.
- Continued weak economic data or a more dovish Fed stance would support this scenario.
- Bullish Case:
- A relief rally could occur from oversold conditions, but the 106.74-106.88 range must be broken to shift sentiment.
- Stronger-than-expected economic data or renewed risk aversion could trigger a short-term rebound.
Outlook: The dollar remains pressured, with key macro data and Fed policy developments likely to drive the next major move. Traders should watch for a potential technical bounce, but the broader trend favors further downside unless a sustained recovery above 106.74 occurs.